
📊 MARKET OVERVIEW
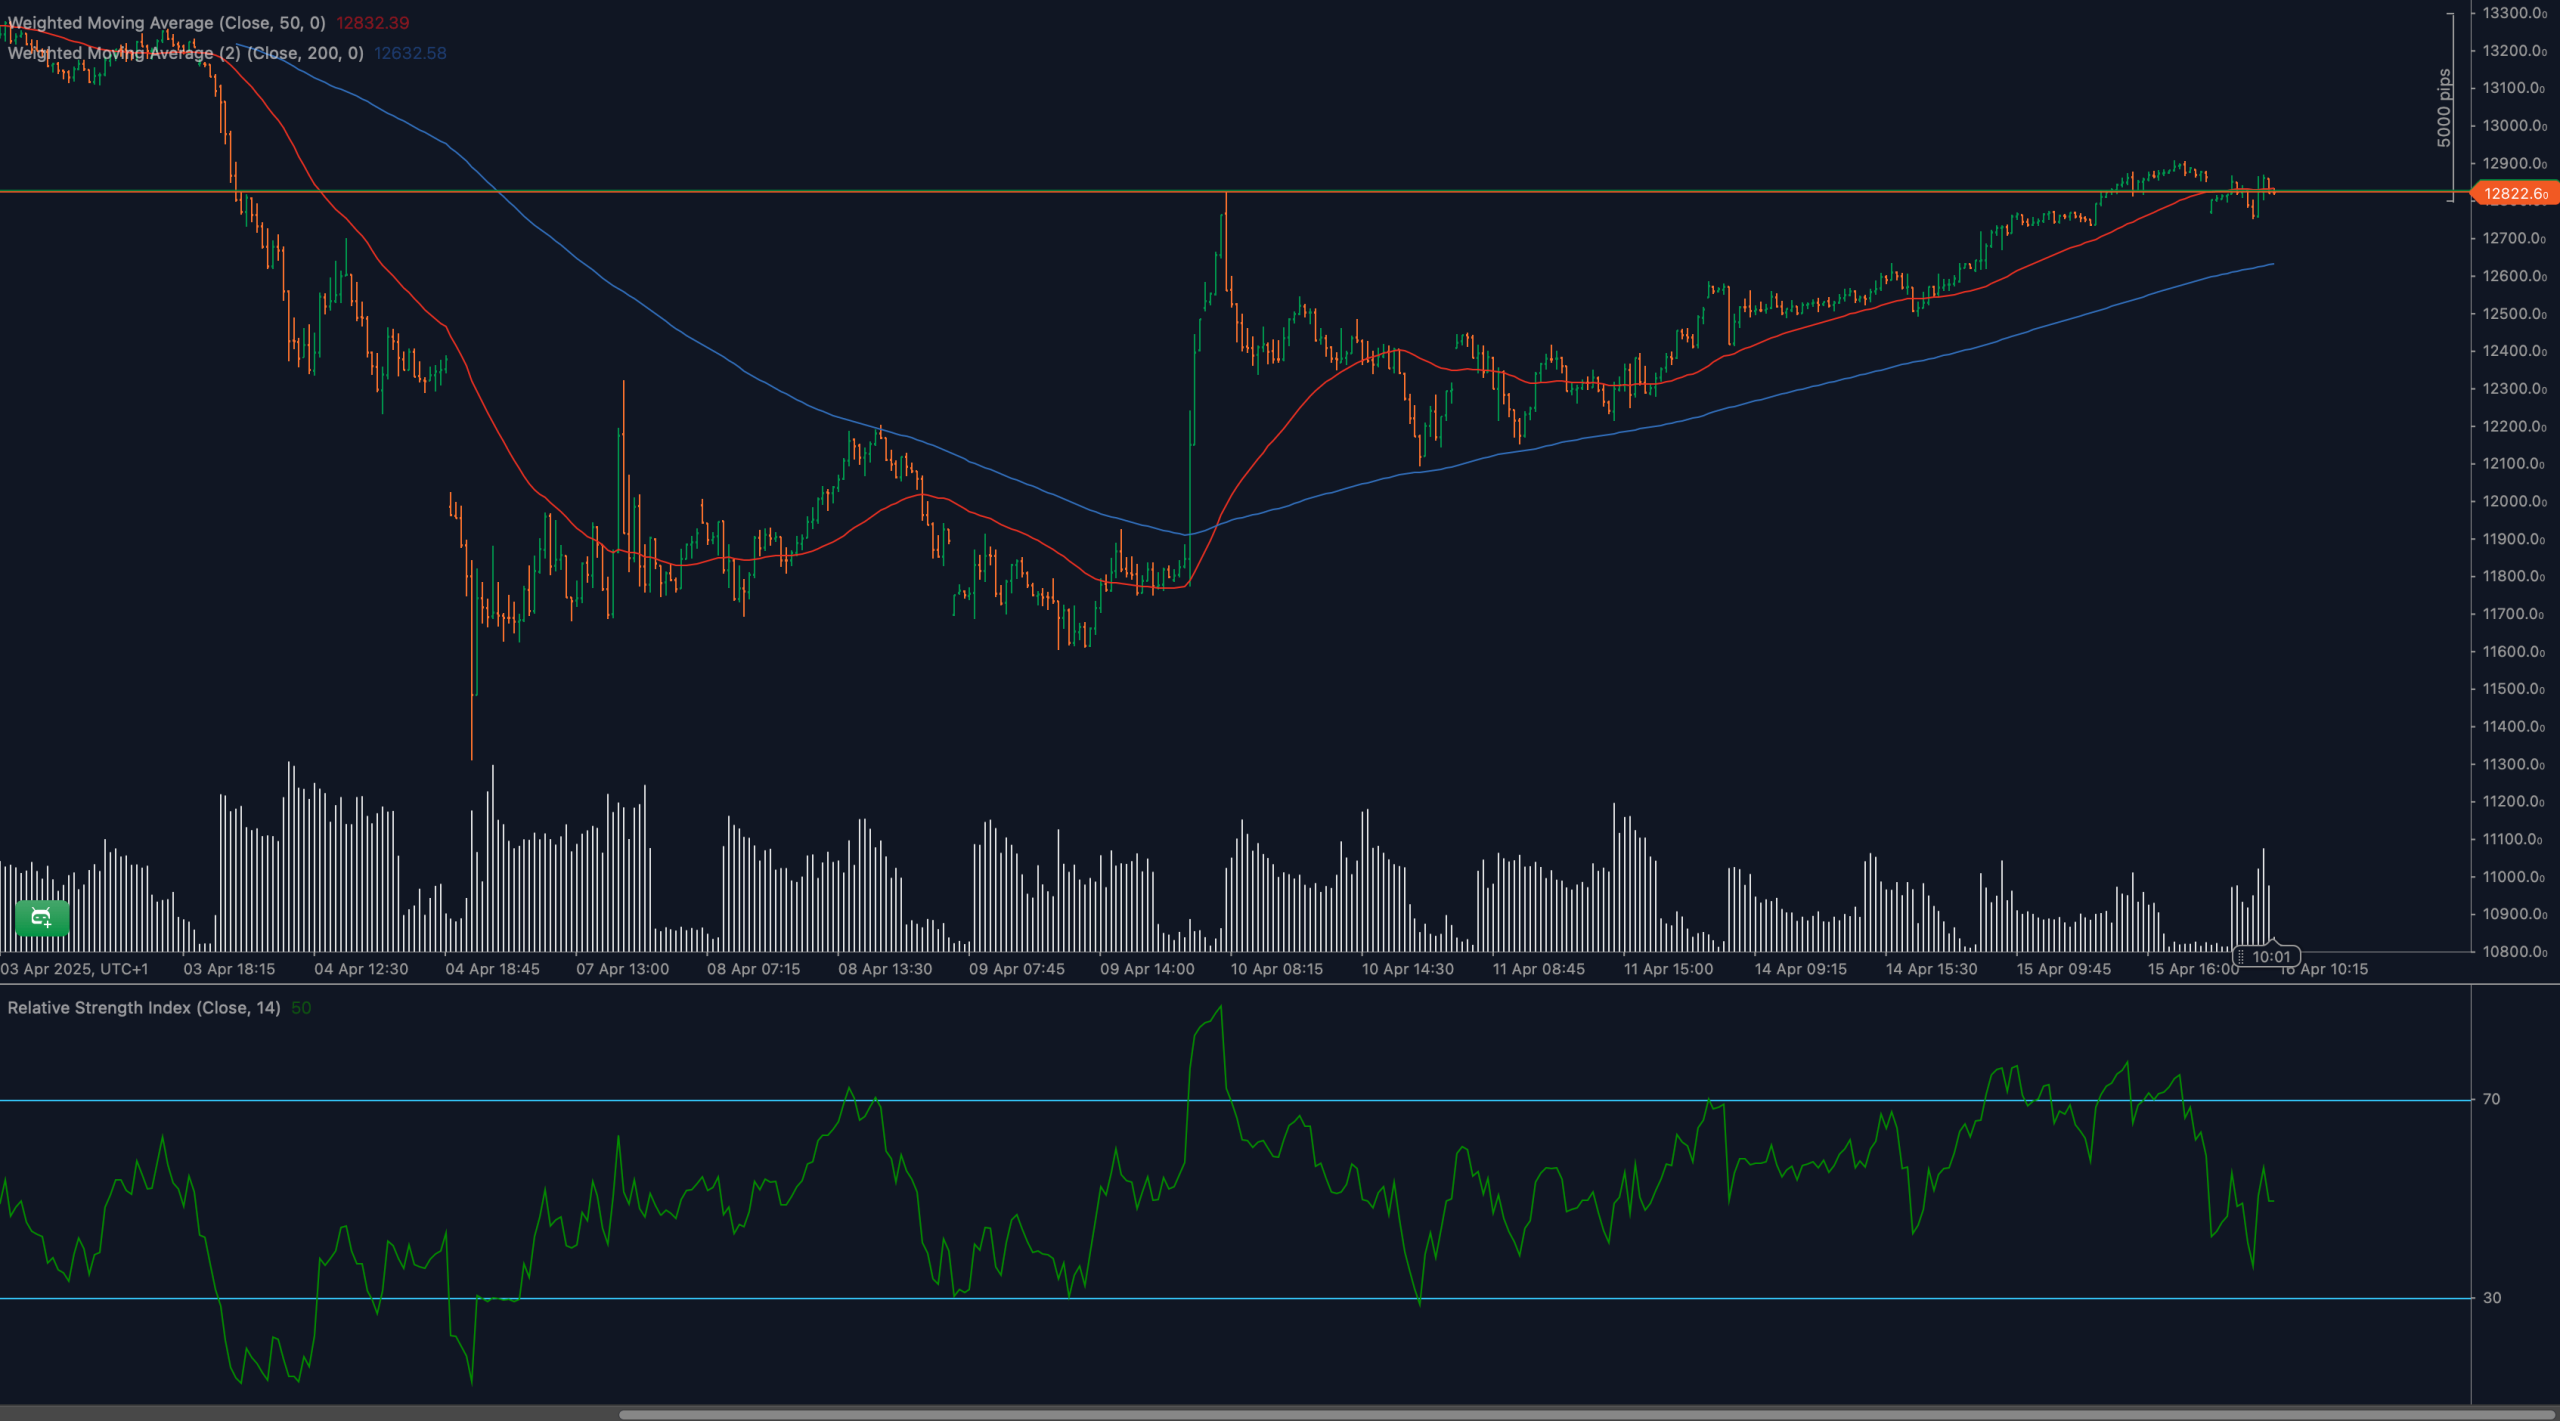
The ESP35 has shown strong upside recovery from early April lows, pushing back toward the 12,825 resistance level— a price ceiling that previously rejected buyers. The trend structure remains bullish overall, with higher lows and higher highs, but momentum indicators are showing early signs of fatigue.
The consolidation around 12,825 comes as the RSI flattens near neutral and volume dries up. The index remains well supported by rising moving averages, signaling that bulls are still in control — but they may need a new catalyst to force a breakout. Until then, traders should prepare for both scenarios: a bullish extension or a rejection-driven pullback.
📈 TECHNICAL ANALYSIS
What Are the Key Support and Resistance Levels for ESP35?
Resistance remains firmly set at 12,825. This level marked the top of the previous bullish push and is now being retested. A break above it would unlock upside potential toward 13,000 and 13,200. On the downside, support lies at 12,600, followed by stronger support at 12,320 near the 200-WMA. A move below this zone could suggest a breakdown in bullish structure.
Moving Average Analysis and Dynamic Price Levels
ESP35 remains above both the 50-period WMA (12,832) and the 200-period WMA (12,632). These moving averages are both upward sloping, reinforcing the broader uptrend. Price is now sandwiched between the 50-WMA and resistance, forming a narrowing range. If price holds above these dynamic supports and breaks resistance, the trend could accelerate.
RSI Momentum Analysis and Divergence Patterns
The 14-period RSI recently retreated from the overbought zone and is now sitting near 50. This reflects a stall in bullish momentum. While there is no bearish divergence yet, RSI’s failure to climb back above 60 on recent rallies suggests buyers are becoming hesitant. A push above 60 would reignite upside interest, while a drop below 45 could lead to deeper consolidation.
Price Action and Candlestick Analysis
Candlestick patterns near 12,825 have been relatively indecisive, with upper wicks forming on multiple recent candles. This price behavior suggests sellers are active near resistance. A strong bullish engulfing candle or close above 12,850would be the clearest sign that bulls are reclaiming control. Without it, price may fade back into the range.
Chart Patterns and Formation Analysis
ESP35 may be forming a small ascending channel or rising wedge, depending on how price behaves over the next sessions. The lack of explosive follow-through suggests a possible distribution phase under resistance. If the pattern breaks upward, it could validate bullish continuation. A break below the lower trendline near 12,600 would mark a short-term reversal setup.
Fibonacci Retracement Levels and Extension Targets
Using the April rally from 11,950 to 12,825, the 23.6% retracement lies around 12,620, with the 38.2% level at 12,480. These zones align with price structure and moving average support. If price breaks higher, Fibonacci extensions suggest 13,000 and 13,200 as the next upside targets. Those levels would align with trend continuation expectations.
🔍 MARKET OUTLOOK & TRADING SCENARIOS
Bullish Scenario for ESP35
A bullish breakout above 12,825, especially if confirmed by a strong candle and RSI rebound above 60, could propel ESP35 toward 13,000 and 13,200. Momentum and volume would need to accompany this move to validate the continuation. The setup remains favorable as long as price holds above the 50-WMA.
Neutral Scenario for ESP35
If price remains stuck between 12,600 and 12,825, traders can expect a range-bound environment. This zone may offer short-term scalping opportunities, but directional conviction will remain muted until a breakout or breakdown confirms trend direction.
Bearish Scenario for ESP35
Failure to break 12,825 followed by a drop below 12,600 would indicate a bearish shift. That could trigger a move toward 12,480 or even 12,320. RSI dropping below 45 and price closing under the 200-WMA would confirm weakening structure. Bearish setups should look for rejection candles near resistance and weak momentum follow-through.
💼 TRADING CONSIDERATIONS
Traders should monitor price action closely at 12,825. A breakout above this level offers high-probability long setups, especially if volume increases and RSI confirms. Long entries can be placed above 12,850 with stops below 12,600, targeting Fibonacci extension levels at 13,000 and 13,200.
If price fails to hold above 12,600, short setups could be explored with confirmation from bearish momentum. Stop-losses for shorts could sit above 12,825, with targets near 12,480 and 12,320. As momentum stalls, adaptive strategies such as trailing stops or partial exits can improve trade outcomes.
🏁 CONCLUSION
ESP35 is testing a major resistance zone at 12,825 after a strong uptrend. While the structure remains bullish, fading momentum and indecisive candles suggest the market is pausing before making its next move. A breakout would confirm continuation, while a rejection could shift the tone back to neutral or even bearish. Traders should stay alert for confirmation signals and align their strategies accordingly.
⚠️ DISCLAIMER
This analysis is for informational purposes only and does not constitute financial advice. Trading involves risk and may not be suitable for all investors. Always conduct your own analysis and consult a qualified financial advisor before making any trading decisions.


