
📊 MARKET OVERVIEW
Gold (XAU/USD) continues its bullish ascent but is now consolidating just beneath the 3225 resistance level. This zone has proven technically significant as price stalls after a multi-session rally. While buyers have controlled momentum recently, emerging signs of slowing strength are beginning to surface, particularly through RSI behavior and shorter-term candlestick formations.
The backdrop of lingering inflation risks, central bank caution, and geopolitical uncertainty continues to underpin gold’s safe-haven appeal. However, from a technical standpoint, the sustainability of the current uptrend may depend on whether bulls can generate sufficient momentum to clear 3225 cleanly and extend toward new highs.
📈 TECHNICAL ANALYSIS
What Are the Key Support and Resistance Levels for XAU/USD?
Immediate resistance stands at 3225. This level has capped price action repeatedly over the last few sessions and now serves as a critical inflection zone. A breakout above could open the door to 3250 and potentially 3280. On the downside, minor support lies around 3200, followed by a stronger zone at 3170. A sustained break below 3155 would mark a structural shift toward a corrective phase.
Moving Average Analysis and Dynamic Price Levels
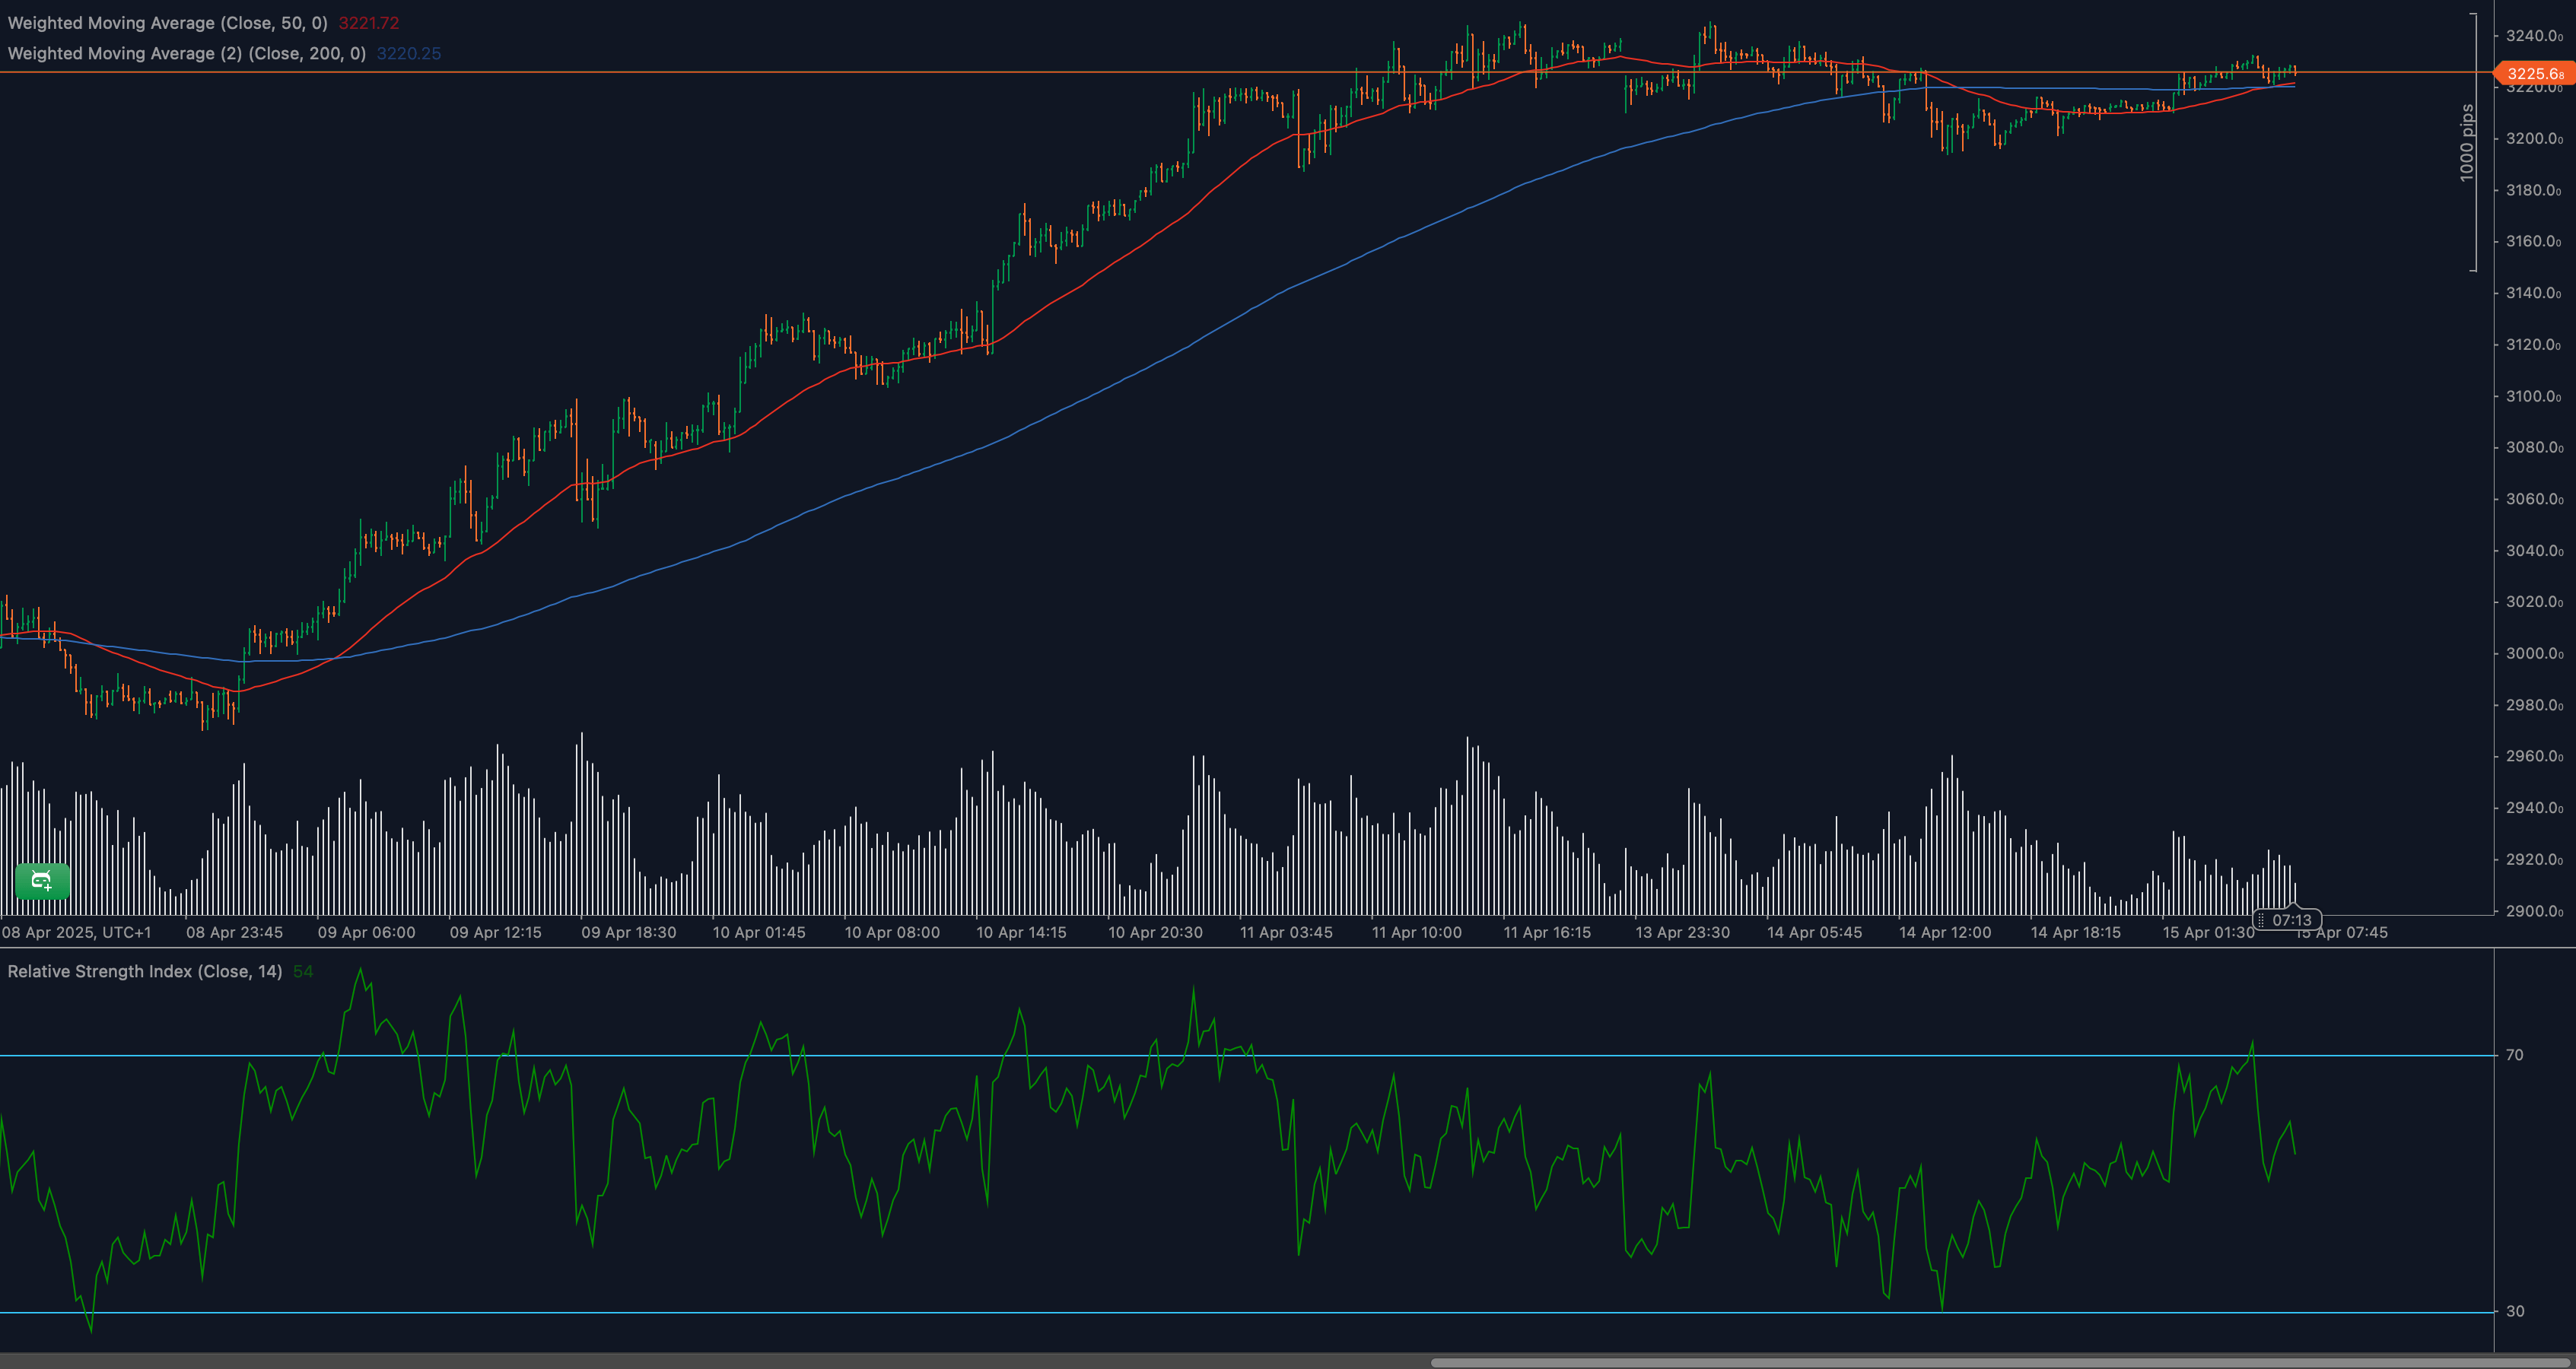
XAU/USD remains comfortably above both the 50-period WMA (3221.72) and the 200-period WMA (3203.25), underscoring a still-bullish structure. The 50-WMA continues to rise steeply, indicating short-term bullish momentum, while the 200-WMA acts as dynamic support for broader trend continuation. However, price is moving sideways just above the 50-WMA, suggesting potential indecision and consolidation under resistance.
RSI Momentum Analysis and Divergence Patterns
The 14-period RSI has been hovering near 70 but recently rolled off its highs, currently reading around 54. This softening RSI signals waning bullish strength and the potential for negative divergence if price pushes higher while RSI trends lower. Momentum is slowing, and without renewed RSI strength, the pair may struggle to overcome 3225.
Price Action and Candlestick Analysis
The recent price action reveals a tightening consolidation range just beneath resistance. Several small-bodied candles with upper wicks indicate fading follow-through from buyers. No major bearish reversal patterns have formed yet, but the lack of upside continuation is a warning signal. A strong bullish close above 3225 would be needed to invalidate current hesitation and confirm continuation.
Chart Patterns and Formation Analysis
Gold appears to be forming a rounded consolidation or slight ascending triangle pattern under the 3225 resistance. This typically precedes a breakout when supported by volume and momentum. However, failure to break higher soon could evolve this structure into a double-top or distribution pattern. The outcome depends heavily on price behavior over the next few sessions.
Fibonacci Retracement Levels and Extension Targets
Using the rally from the April 9 low to the recent high near 3225, the 23.6% Fibonacci retracement lies at approximately 3205, aligning with near-term support. The 38.2% retracement sits near 3170, marking the deeper corrective support. For bullish extensions, a clean break above 3225 targets 3250 (127.2%) and 3280 (161.8%) as logical upside projections.
🔍 MARKET OUTLOOK & TRADING SCENARIOS
Bullish Scenario for XAU/USD
A bullish breakout above 3225 with strong volume and RSI strength returning above 60 could confirm the continuation of the upward move. This would place 3250 and potentially 3280 within reach. Traders should look for decisive bullish candles and expanding volume to validate this scenario.
Neutral Scenario for XAU/USD
If XAU/USD continues to consolidate beneath 3225, a range-bound structure between 3200 and 3225 may persist. RSI holding between 50–60 and price coiling just above the 50-WMA would support this scenario. Traders may consider breakout preparation strategies or trade short-term reversals within the range.
Bearish Scenario for XAU/USD
Failure to break 3225 followed by a close below 3200 would trigger a short-term bearish shift. This would bring 3170 and potentially 3155 into focus. RSI falling below 45 and bearish engulfing candles would provide further confirmation of downside intent.
💼 TRADING CONSIDERATIONS
With XAU/USD consolidating under resistance, breakout traders should remain patient for a confirmed push above 3225 with accompanying RSI and volume confirmation. Stops can be placed below 3200 to protect against false breaks, while profit targets may extend toward 3250 and 3280.
Counter-trend traders may also consider short setups on clear rejection candles from resistance, especially if RSI continues to weaken. In such cases, stops should be tightly managed above 3225, targeting initial downside at 3170 with partial exits along the way.
Risk management remains essential with volatility expected to increase near key resistance levels. Traders should rely on confluence from indicators, candlesticks, and volume patterns before committing to directional bias.
🏁 CONCLUSION
Gold is trading just beneath the critical 3225 resistance following a strong bullish run. While price action and moving averages still favor bulls, RSI signals softening momentum and growing indecision. Whether price breaks out or pulls back from this zone will be decisive in shaping short-term direction. Traders should closely monitor this level for breakout validation or rejection cues, and adjust strategies accordingly.
⚠️ DISCLAIMER
This analysis is for informational purposes only and does not constitute financial advice. Trading carries inherent risk and may not be suitable for all investors. Always perform your own due diligence and consult with a licensed financial professional before making trading decisions.


