
📊 MARKET OVERVIEW
The CAC 40 index has experienced a significant bullish reversal in recent days, with price action suggesting renewed investor confidence in French equities. After establishing a solid base around the 7900 level, the index has rallied with conviction, breaking above both the 50-day and nearing the 200-day moving averages. This technical improvement comes as global markets adjust to economic data and central bank policies, with the French benchmark now testing a critical horizontal resistance level at approximately 8050 that has previously acted as both support and resistance.
📈 TECHNICAL ANALYSIS
What Are the Key Support and Resistance Levels for CAC 40?
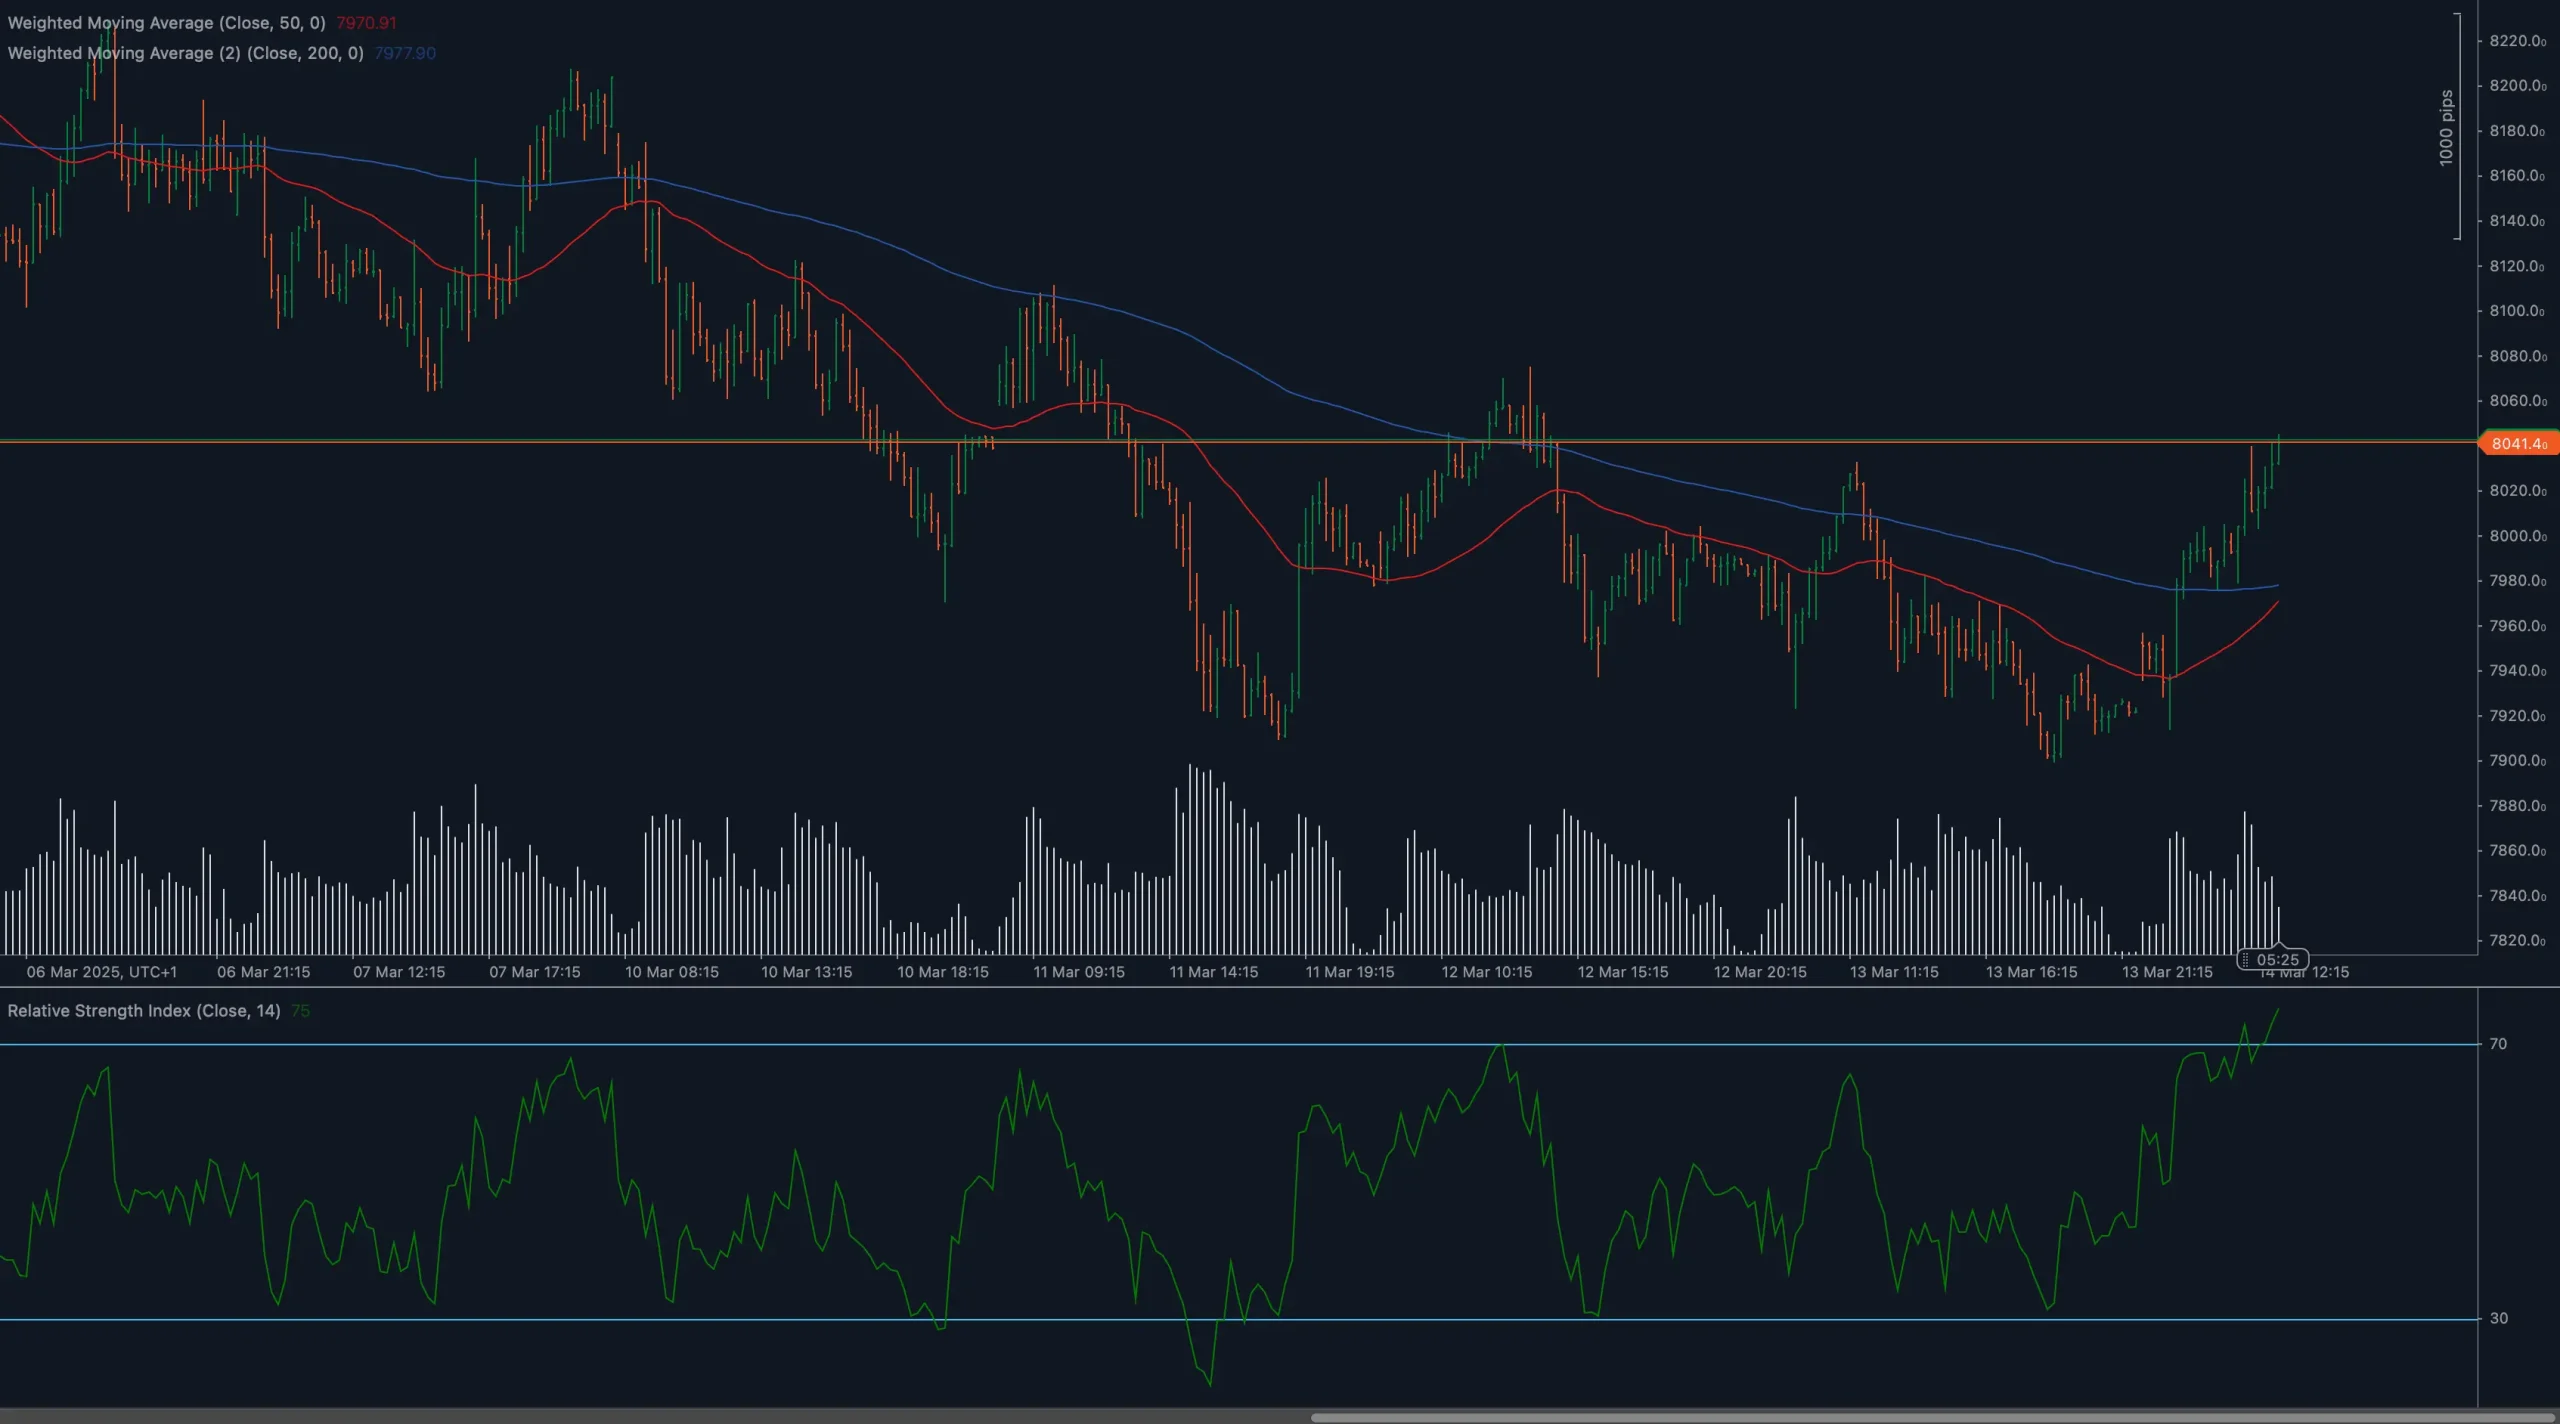
Looking at the chart, the CAC 40 is currently testing a significant horizontal resistance level around 8050 (marked by the red horizontal line). This price zone has historically acted as both support and resistance, making it a critical decision point for the index. Should bulls succeed in breaking above this level, the next resistance would likely emerge near the 8200 handle. On the downside, recent price action has established support at the 7900 area, with additional support around 7750 where previous consolidation occurred.
Moving Average Analysis and Dynamic Price Levels
The relationship between price and key moving averages tells an important story for the CAC 40. The index has recently broken above the 50-day moving average (red line), which signals improving short-term momentum. However, the 200-day moving average (blue line) remains overhead, currently situated around 8100. This creates a challenging zone between current price and the 200-day MA that bulls must overcome for a sustainable uptrend to be confirmed. The recent price action shows the 50-day MA beginning to flatten and potentially turn upward, which would be a positive development if confirmed in coming sessions.
RSI Momentum Analysis and Divergence Patterns
The Relative Strength Index (RSI) at the bottom of the chart shows strengthening momentum, currently reading around 65-70 and approaching overbought territory (70+). This strong momentum supports the recent price advance, though traders should be cautious as overbought readings can sometimes precede short-term corrections. What’s particularly notable is the absence of significant divergence between price and RSI, suggesting the current rally has healthy momentum behind it. The RSI has been making higher lows since mid-March, confirming the bullish structure of the recent advance.
Price Action and Candlestick Analysis
The recent candlestick patterns reveal strong bullish conviction. After forming a series of higher lows, the CAC 40 has produced several strong bullish candles with minimal upper wicks, indicating buying pressure throughout the sessions. The last few days show particularly decisive price action, with candles closing near their highs and demonstrating increasing volume (as seen in the volume bars beneath the price chart). This type of price behavior typically suggests institutional participation and conviction in the move higher.
Chart Patterns and Formation Analysis
The CAC 40 appears to have completed a potential inverse head and shoulders pattern, with the neckline around the 7900-7950 area. This bullish reversal pattern, if confirmed by continued upside momentum, suggests a measured move target approximately 300-350 points higher from the breakout level, potentially targeting the 8250-8300 zone. Additionally, the recent consolidation phase has created a bullish flag pattern that has now resolved to the upside, reinforcing the bullish bias of the current market structure.
Fibonacci Retracement Levels and Extension Targets
While Fibonacci levels aren’t explicitly marked on the chart, we can infer that the recent rally has likely reclaimed the 38.2% or 50% retracement of the previous decline. If the rally continues, the 61.8% retracement would become a logical resistance zone, which would likely align with the 8150-8200 area. For extension targets, a breakthrough above the current resistance could see the CAC 40 test the 1.0 extension level, potentially around 8300-8350 based on the visible price structure.
🔍 MARKET OUTLOOK & TRADING SCENARIOS
Bullish Scenario for CAC 40
In the bullish case, the CAC 40 successfully breaks and holds above the 8050 resistance level with increasing volume, confirming the inverse head and shoulders pattern. This would likely lead to a test of the 200-day moving average around 8100, followed by potential moves toward 8200 and eventually 8300. Supporting this scenario would be continued strength in the RSI, potentially moving into overbought territory but maintaining its upward trajectory. The 50-day MA would likely accelerate its turn higher, eventually creating a “golden cross” with the 200-day MA, which would attract additional technical buyers.
Neutral Scenario for CAC 40
A neutral scenario would involve the CAC 40 meeting resistance at the current 8050 level, leading to a period of consolidation between 7900 and 8050. This would create a range-bound environment where the index digests recent gains while building energy for the next directional move. The RSI would likely stabilize in the 50-60 range, neither confirming a strong trend nor signaling a reversal. This scenario would give the 50-day MA time to continue its turn higher while price builds a stronger base before attempting another breakout.
Bearish Scenario for CAC 40
Should sellers regain control, the CAC 40 could face rejection at the 8050 resistance and the 200-day MA, leading to a pullback toward the 7900 support zone. A break below this level would invalidate the bullish pattern and potentially signal a test of the 7750 area or even lower support around 7600. This scenario would likely be accompanied by the RSI turning lower from current levels and moving back below 50, and the 50-day MA failing to turn convincingly higher. The volume would likely increase on down days, confirming selling pressure.
💼 TRADING CONSIDERATIONS
When approaching the CAC 40 in the current technical environment, traders should consider several key factors. First, position sizing should reflect the proximity to key resistance levels – smaller positions might be prudent given the index is testing significant resistance. For those bullish on the CAC 40, waiting for a confirmed breakout above 8050 with strong volume could provide a better risk-reward entry, with stops placed below recent swing lows around 7900.
For those looking to trade within the range, selling near 8050 resistance with targets at 7900 support could be considered, though with tight risk management given the bullish momentum. Traders should also pay attention to market correlations, as the CAC 40 often moves in line with other European indices like the DAX and broader global equity sentiment.
Risk management is paramount given the index’s location at a critical decision point. Stops should be placed at levels that invalidate your trading thesis – for bullish trades, below 7900; for bearish countertrend trades, above 8100. Given the recent volatility, options strategies like vertical spreads might offer defined risk exposure for those looking to trade the potential breakout or rejection.
🏁 CONCLUSION
The CAC 40 is at a critical juncture, testing key resistance at 8050 after a strong bullish rally from support. The technical picture shows improving momentum with the index now above the 50-day MA and approaching the 200-day MA. The RSI confirms this strength but is nearing overbought territory, suggesting caution. The completed inverse head and shoulders pattern provides a bullish bias, but the resistance overhead cannot be ignored.
Traders should watch for a definitive break above 8050 to confirm continuation of the bullish trend, with targets at 8200 and potentially 8300. Alternatively, rejection at current levels could lead to a retest of 7900 support. As always with index trading, keeping an eye on broader market sentiment, economic data releases, and correlations with other major indices will provide additional context for CAC 40 technical signals.
⚠️ DISCLAIMER
This technical analysis is provided for informational purposes only and should not be construed as investment advice. Trading financial markets carries significant risk, and past performance is not indicative of future results. Always conduct your own research and consider consulting with a licensed financial advisor before making any investment decisions. The analysis provided is based on technical chart patterns and indicators, which are subject to interpretation and may not accurately predict future market movements. Never risk more capital than you can afford to lose.


