
📊 MARKET OVERVIEW
The British Pound has demonstrated remarkable strength against the US Dollar, with GBPUSD establishing a clear uptrend on the charts. Cable has broken above the significant 1.2840 resistance level, reaching fresh multi-week highs as bullish momentum accelerates. This movement comes amid changing market sentiment regarding central bank policies, with traders adjusting positions based on evolving interest rate expectations between the Federal Reserve and Bank of England. The technical picture for GBPUSD reveals strong buying pressure supported by positive momentum indicators and favorable moving average alignments, suggesting potential for further upside in the near term.
Recent price action shows a decisive break above previous congestion zones, with volume confirmation supporting the validity of this breakout. The pair has maintained its position above critical moving averages, establishing higher lows and higher highs – a classic indication of bullish market structure. With key technical indicators aligning in favor of the uptrend, GBPUSD appears positioned to challenge psychological resistance levels, making this a critical juncture for traders monitoring the Sterling-Dollar exchange rate.
📈 TECHNICAL ANALYSIS
What Are the Key GBPUSD Support and Resistance Levels?
The GBPUSD chart reveals several critical technical levels that traders should monitor. The most immediate resistance now sits at the 1.2860 level, followed by the psychologically significant 1.2900 round number. A sustained break above these levels could trigger additional buying interest, potentially opening the path toward 1.2950 and the 1.3000 major psychological barrier. The volume profile indicates substantial trading activity at these levels, reinforcing their significance as potential reversal points.
Support levels have been established at 1.2800, which aligns with the recent consolidation zone high, followed by the more substantial 1.2780 level where the 50-period moving average currently intersects. Below this, the 1.2720 zone represents a critical area that previously acted as resistance before becoming support. The 200-period moving average currently trending near 1.2660 provides a longer-term support barrier that should contain any significant corrections. These multiple layers of support create a favorable risk management environment for traders maintaining bullish positions.
Moving Average Analysis for GBPUSD
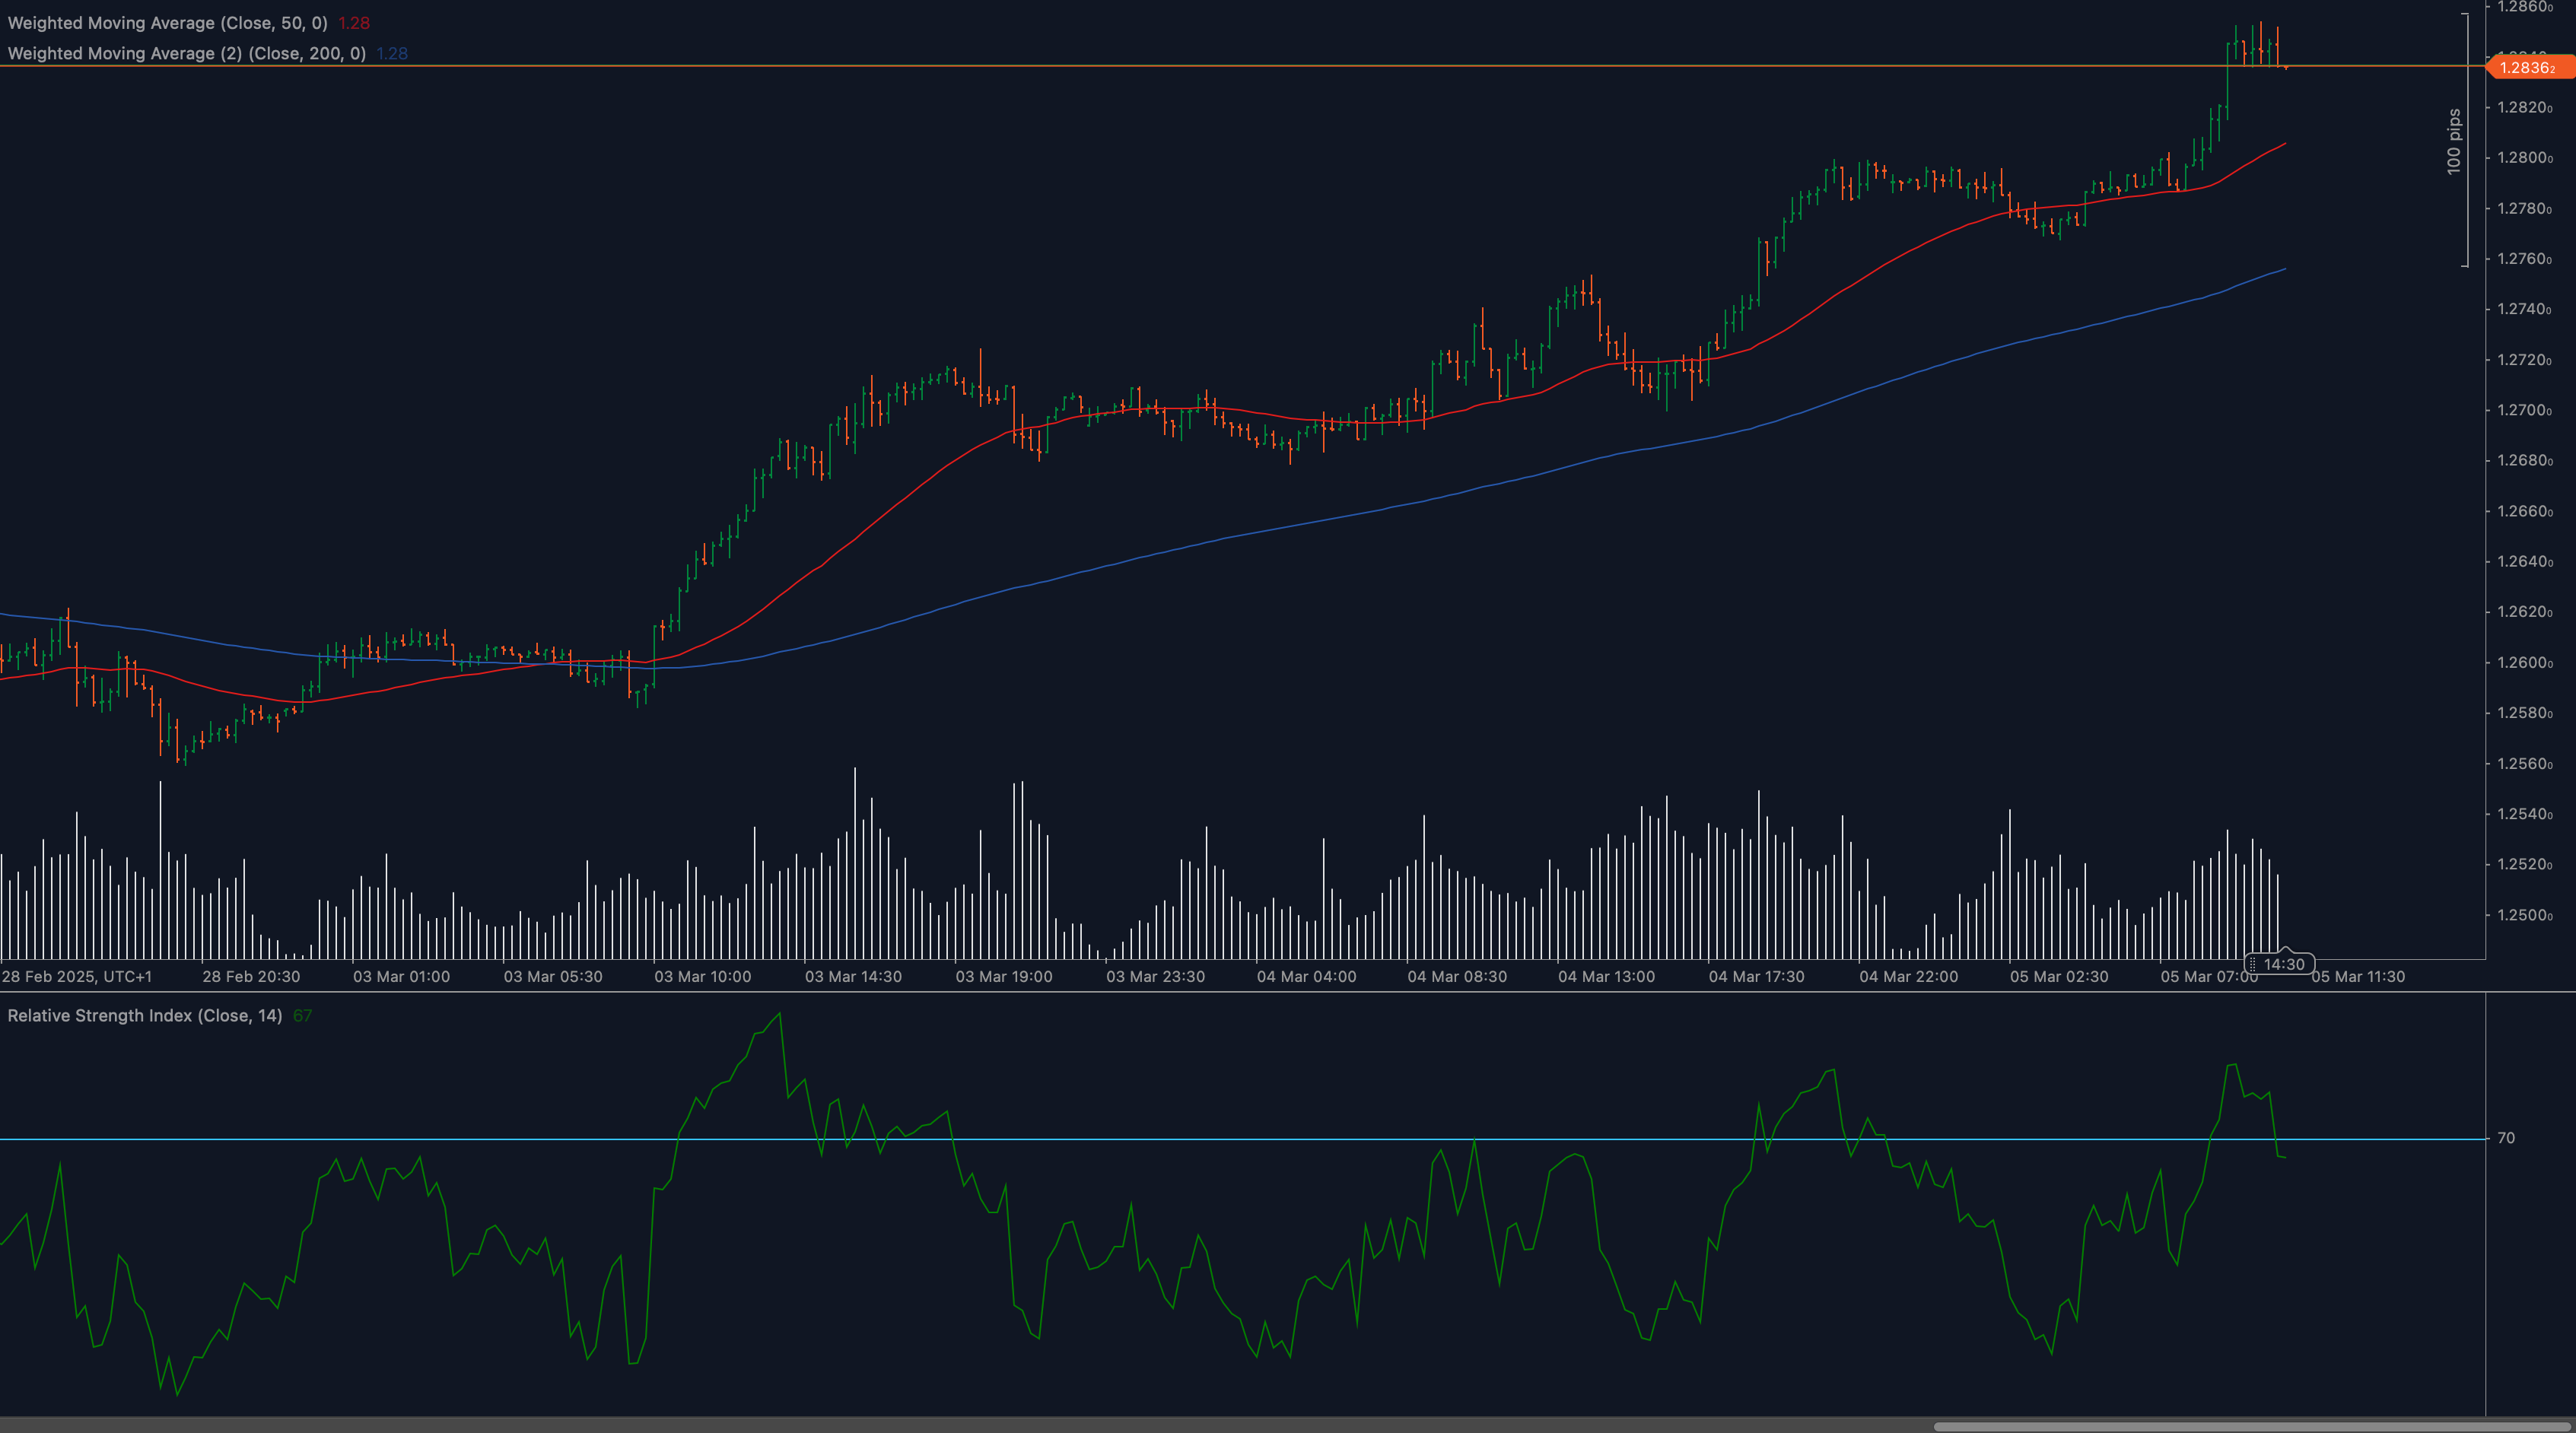
The moving average configuration presents a decidedly bullish picture for GBPUSD. The 50-period moving average (red line) has crossed above the 200-period moving average (blue line), forming a golden cross pattern – a traditionally bullish signal indicating potential for sustained upward momentum. The price is currently trading well above both of these moving averages, confirming the strength of the uptrend.
The 50-period MA is sloping upward at an increasingly steep angle, suggesting acceleration in bullish momentum. This moving average has also acted as dynamic support during recent minor pullbacks, with price respecting this level before continuing higher. The increasing distance between the price and the 200-period MA indicates strong bullish conviction, though traders should be cautious of potential mean reversion if this gap becomes excessive in the short term.
RSI and Momentum Analysis
The Relative Strength Index (14) presents interesting insights into the current market dynamics for GBPUSD. The indicator has been oscillating between 40 and 70, showing healthy momentum without reaching extreme overbought conditions that would typically signal exhaustion. Recent RSI movements show higher lows coinciding with price dips, confirming the underlying strength of the trend.
The RSI has maintained readings above 50 throughout most of the analyzed period, confirming the presence of bullish momentum. While several oscillations near the 70 level suggest brief periods of buying exhaustion, the indicator has quickly reset without significant price corrections, indicating robust underlying buying pressure. Traders should watch for potential divergence between price and RSI as a warning sign of weakening momentum, though none is currently evident on the chart.
GBPUSD Price Action and Chart Patterns
The price action for GBPUSD demonstrates classic bullish behavior, with a series of higher lows and higher highs establishing a clear uptrend. The recent breakout above 1.2840 was preceded by a period of consolidation, creating a bullish flag pattern that has now resolved to the upside with strong momentum. Candle formations show consistent bullish closes with limited upper wicks, indicating minimal selling pressure at higher levels.
Volume analysis supports the validity of the current move, with increased participation during breakout sessions and declining volume during consolidation phases. The most recent candles show strong bullish momentum with minimal retracement, suggesting confident buying rather than speculative activity. This price action behavior, combined with the clean break above previous resistance, provides technical confirmation of the trend’s robustness.
Fibonacci Retracement Levels
Applying Fibonacci retracement tools to the recent upward movement from 1.2580 to 1.2846 highlights several potential support zones that align with other technical elements. The 23.6% retracement level at approximately 1.2782 coincides with the 50-period moving average, creating a confluence zone of support. The 38.2% retracement at 1.2745 aligns near previous resistance turned support, while the 50% retracement at 1.2713 offers another significant support level.
These Fibonacci levels provide traders with strategic entry points during potential pullbacks, offering favorable risk-reward ratios for those looking to join the established uptrend. The alignment of these mathematical levels with observed market structure increases their reliability as technical reference points for trading decisions.
🔍 MARKET OUTLOOK & TRADING SCENARIOS
Bullish Scenario for GBPUSD
In the bullish case, GBPUSD continues its upward trajectory beyond 1.2860, targeting the psychological 1.2900 level in the near term. Sustained momentum could push the pair toward 1.2950 and eventually challenge the significant 1.3000 barrier. This scenario is supported by continued alignment of bullish technical indicators, including maintained positions above key moving averages and RSI readings that remain strong without reaching extreme overbought conditions. Fundamentally, this would likely be accompanied by continued market perception of diverging monetary policies between the Federal Reserve and Bank of England, with the latter maintaining a more hawkish stance.
The most favorable risk-reward opportunity in this scenario would be entering on shallow pullbacks to support levels, particularly the 1.2800-1.2780 zone where multiple technical elements converge. Stop losses could be placed below the 50-period moving average with targets set at 1.2900 and 1.2950, offering favorable risk-reward ratios of 1:2 or better.
Neutral Scenario for GBPUSD
The neutral outlook envisions GBPUSD entering a period of consolidation between 1.2780 and 1.2860 as the market digests recent gains and awaits fresh catalysts. In this scenario, price action would form a range-bound pattern with clear boundaries, providing opportunities for range-trading strategies. The moving averages would continue their upward slope but at a decreasing rate, while RSI oscillates between 40 and 60, reflecting balanced market forces.
Traders adopting this scenario would benefit from implementing range-trading approaches, buying near support at 1.2780-1.2800 and selling near resistance at 1.2840-1.2860. Position sizing should be more conservative than in trending markets, with profit targets set within the established range rather than projecting breakouts in either direction.
Bearish Scenario for GBPUSD
The bearish case would materialize if GBPUSD fails to sustain levels above 1.2800 and breaks below the 50-period moving average support. This would potentially trigger a deeper correction toward the 1.2720 level initially, with further weakness possibly extending to test the 200-period moving average near 1.2660. Such a scenario would likely be accompanied by RSI breaking below 40 and moving averages beginning to flatten their positive slope.
Risk management becomes crucial in this scenario, with traders implementing tighter stop losses above recent swing highs and considering partial profit-taking on existing long positions. Fresh short positions would only become favorable if price action confirms the bearish shift through lower highs and lower lows, with initial targets at the identified support levels and potential for deeper correction if fundamental catalysts align with technical deterioration.
💼 TRADING CONSIDERATIONS
Implementing effective risk management remains paramount when trading GBPUSD in the current environment. Position sizing should reflect the observed volatility, with the average daily range suggesting appropriate stop placement to avoid premature exits during normal market fluctuations. The current technical structure offers several advantageous risk-reward setups, particularly for traders looking to enter on pullbacks to established support levels.
Traders should remain vigilant regarding upcoming economic data releases affecting both the British Pound and US Dollar, including inflation figures, employment statistics, and central bank communications. These fundamental catalysts can trigger short-term volatility that may present both risks and opportunities within the established technical framework. Implementing trailing stops on profitable positions can protect gains while allowing trades to capture extended momentum if the bullish trend accelerates.
Market correlation analysis indicates that GBPUSD movements may also be influenced by broader risk sentiment affecting global markets. Traders should monitor related instruments such as EURUSD, UK equities, and US Treasury yields for confirmation or divergence signals that could impact GBPUSD’s technical outlook. Divergences between correlated assets often precede significant market turning points and warrant increased caution.
🏁 CONCLUSION
The technical analysis of GBPUSD reveals a strong bullish structure supported by multiple indicators and price action confirmation. The pair has established a clear uptrend with the recent breakout above 1.2840 resistance, supported by favorable moving average configurations and healthy momentum readings. While some caution is warranted given the extended nature of the current move, the multiple layers of support below current prices create opportunities for favorable risk-reward entries.
Traders should focus on managing risk appropriately while positioning to benefit from the established trend, with particular attention to potential pullbacks that may offer advantageous entry points. The technical outlook suggests continued strength for GBPUSD with targets at 1.2900 and potentially 1.2950, though vigilance regarding changing market conditions remains essential. With proper risk management and technical awareness, the current GBPUSD market structure offers compelling opportunities for technically-oriented traders.
⚠️ DISCLAIMER: This analysis is for informational purposes only and should not be considered financial advice. Trading carries risk, and past performance does not guarantee future results. Conduct independent research before making investment decisions.


