
📊 MARKET OVERVIEW
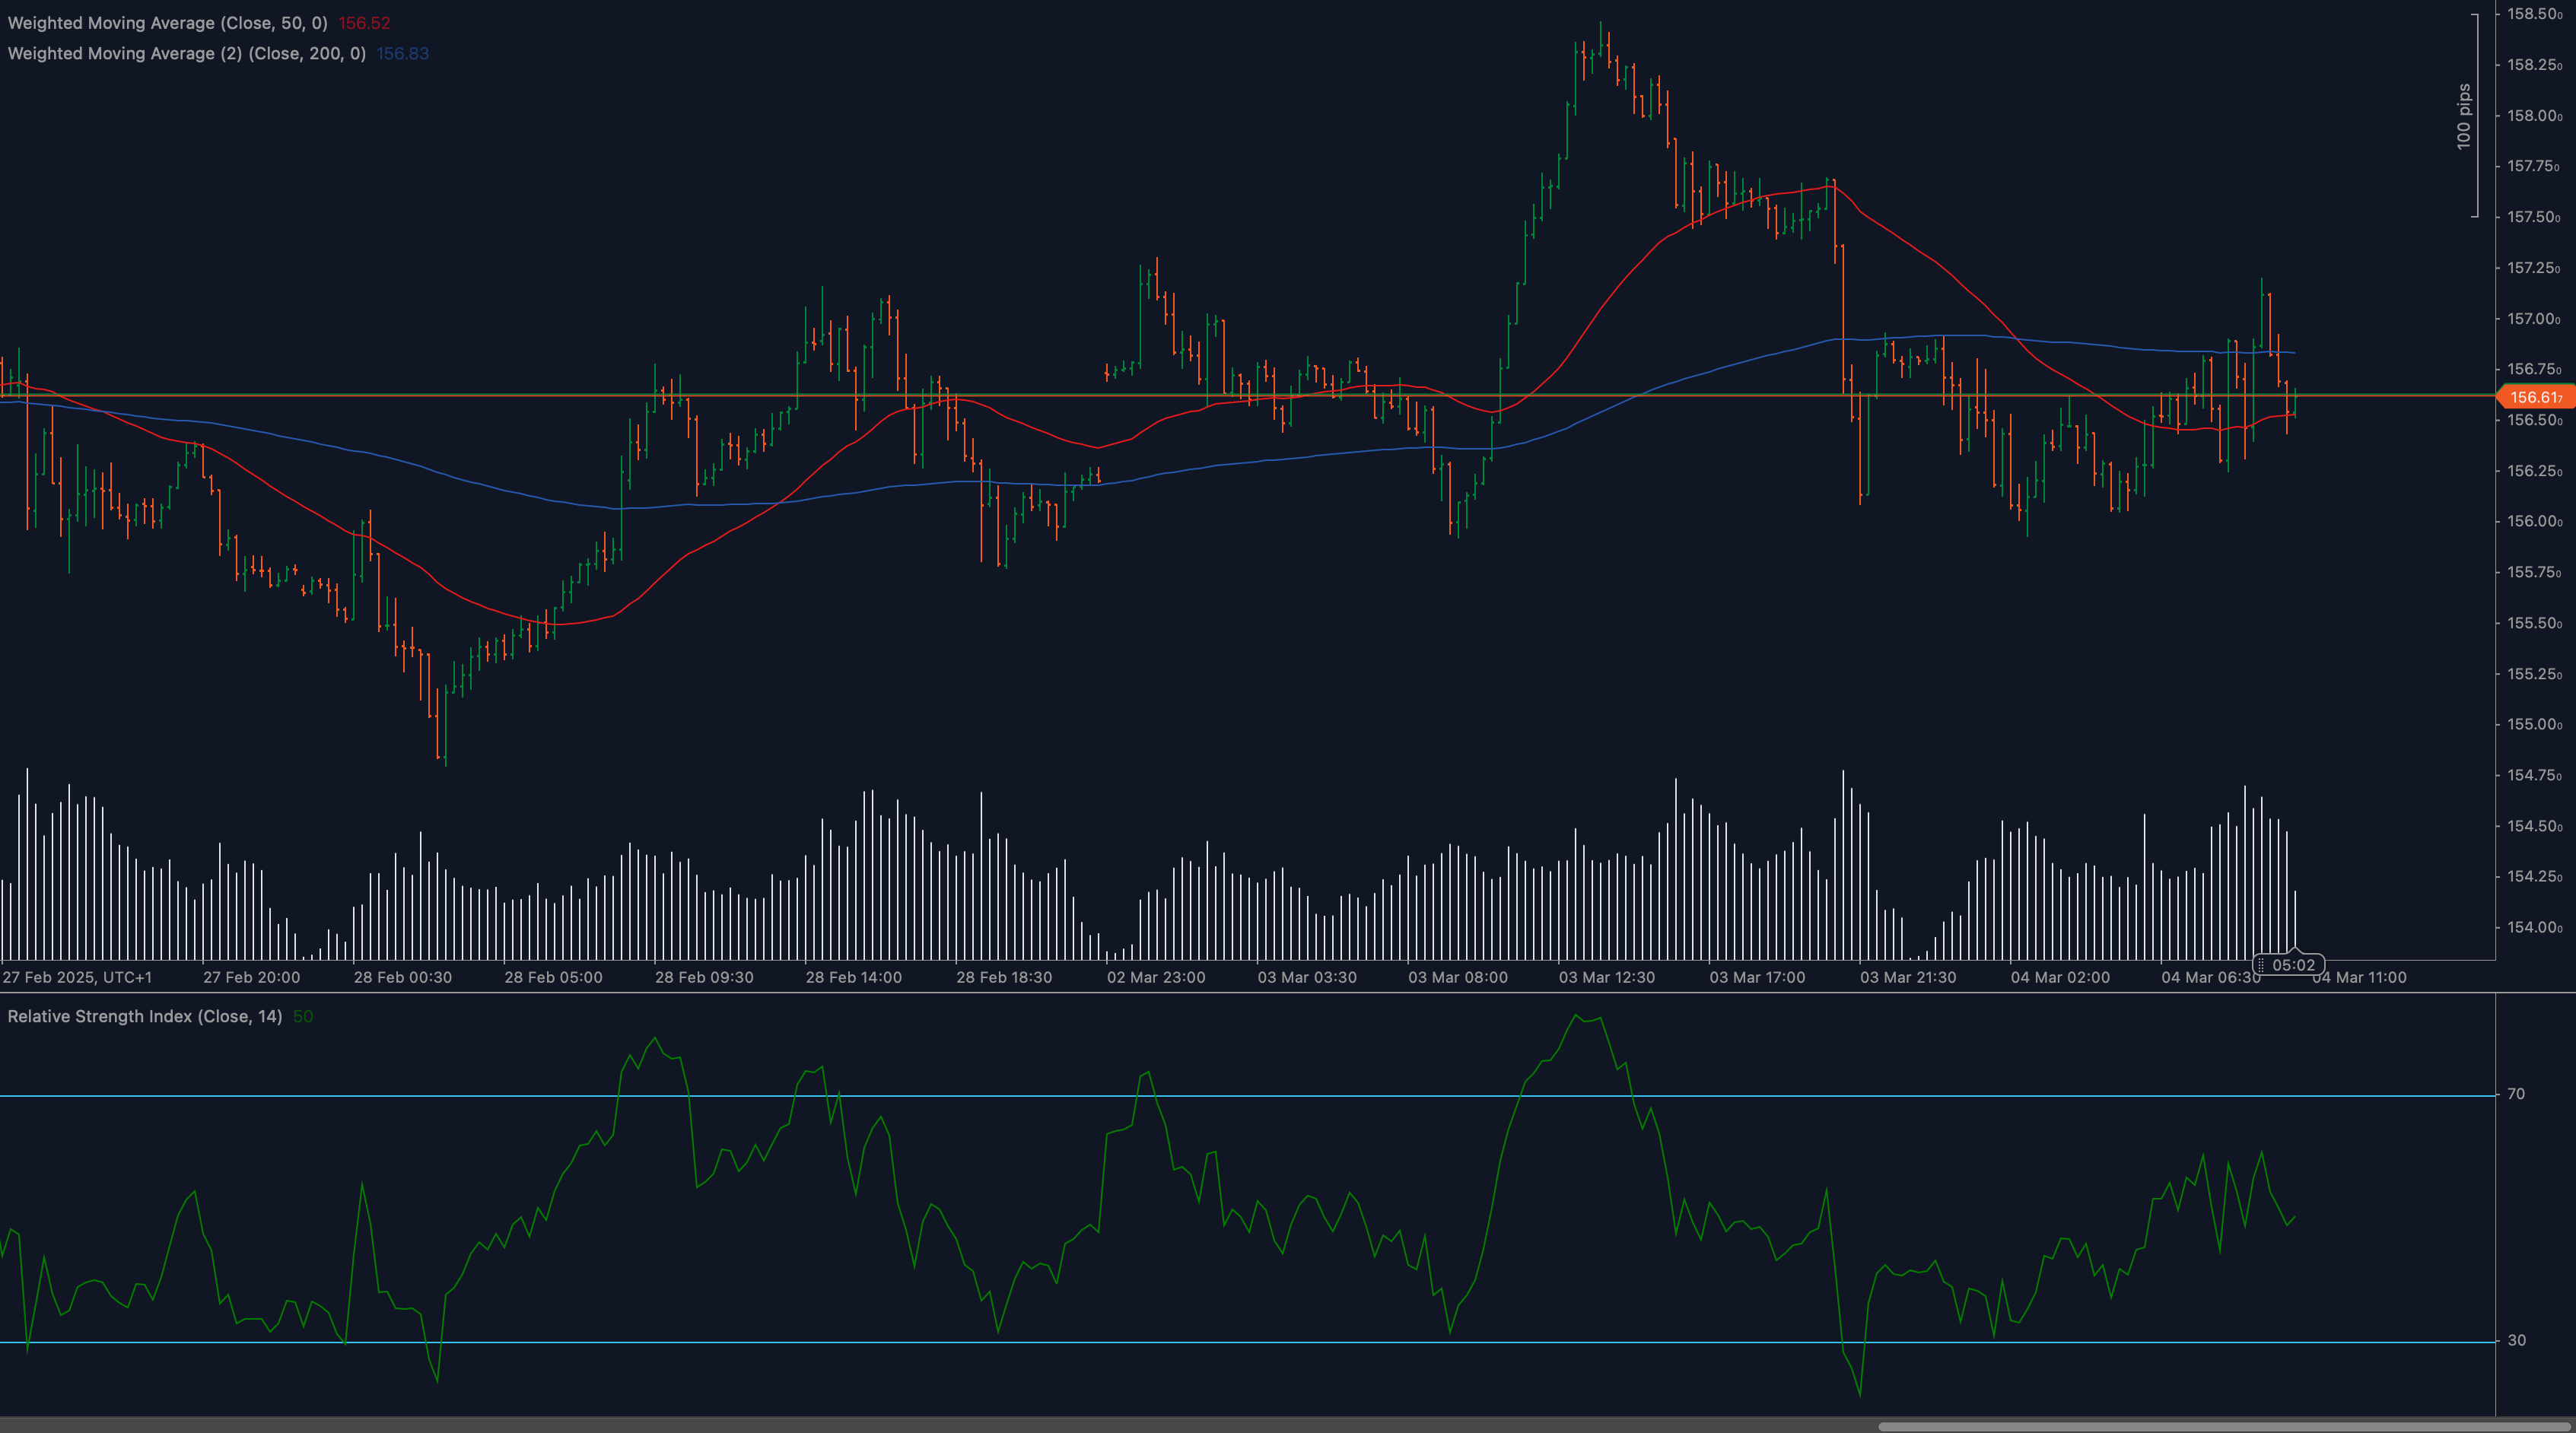
The EUR/JPY currency pair has entered a critical phase as price action indicates a delicate balance between bullish and bearish forces around the pivotal 156.50 level. After experiencing a substantial rally to the 158.00 region in early March, the pair has undergone a notable pullback, with price now compressed between the 50-period moving average (red line) and 200-period moving average (blue line). This technical configuration has created a battleground that will likely determine the medium-term trajectory for this cross pair. The current consolidation occurs amid broader market considerations regarding interest rate differentials between the Eurozone and Japan, with traders closely monitoring signals from both the European Central Bank and Bank of Japan for potential policy shifts.
The price structure shows a series of lower highs and higher lows, forming a symmetrical triangle pattern that typically precedes a significant directional move. This compression of volatility, combined with the convergence of key moving averages, suggests an imminent breakout scenario that could define the next substantial trend for EUR/JPY traders.
📈 TECHNICAL ANALYSIS
What Are the Key Support and Resistance Levels for EUR/JPY?
The EUR/JPY has established several critical technical levels that warrant close attention. The immediate resistance at 156.80 (highlighted in the chart) represents a significant barrier that coincides with the 50-day moving average. This level has repeatedly rejected upward price movements, establishing itself as a formidable obstacle. Beyond this, the secondary resistance zone at 157.50-157.75, which previously acted as support during the early March rally, has now transformed into resistance.
On the support side, the immediate zone at 156.00-156.25 provides crucial underpinning, with the psychological 156.00 level being particularly important. Should this support fail, the next significant zone appears around 155.50, followed by a more substantial support region at 155.00, which previously halted the January decline.
Moving Average Analysis
The relationship between price and key moving averages provides critical insights into EUR/JPY’s trend structure. Currently, the 50-day moving average (red line) at approximately 156.80 is acting as overhead resistance, while the 200-day moving average (blue line) around 156.40 is providing underlying support. This configuration places the pair in a tight consolidation zone between these two crucial technical indicators.
The converging moving averages suggest decreasing trend momentum and increasing probability of a volatility expansion event. When major moving averages compress price action in this manner, the eventual breakout typically carries significant momentum, making the current technical setup particularly noteworthy for traders positioning in this currency pair.
RSI Indicator Assessment
The Relative Strength Index (14-period) shown at the bottom of the chart is registering readings between the 30 and 70 boundaries, indicating neither overbought nor oversold conditions. However, closer inspection reveals the RSI has been forming higher lows since late February, suggesting gradually building bullish momentum despite the price consolidation.
This divergence between price action and momentum could foreshadow an upcoming bullish move if confirmed by a decisive break above resistance. Traders should monitor this RSI structure closely, as continuation of this pattern would strengthen the case for an eventual upside resolution to the current consolidation phase.
Price Action and Candlestick Analysis
Recent candlestick formations on the EUR/JPY chart reveal the ongoing battle between buyers and sellers. Several instances of rejection at the 156.80 level are evident through pronounced upper wicks, indicating selling pressure at this resistance. Conversely, the presence of long lower wicks near the 156.00 support suggests buyers remain active at lower levels.
The most recent trading sessions show alternating bullish and bearish candles with relatively balanced dimensions, confirming the consolidative nature of current price action. This equilibrium between buyers and sellers further reinforces the significance of the eventual breakout from the current symmetrical triangle pattern.
Chart Patterns and Market Structure
The EUR/JPY is currently forming a well-defined symmetrical triangle pattern on the hourly timeframe, with converging trendlines connecting the series of lower highs and higher lows. The apex of this pattern is approaching rapidly, suggesting resolution within the coming trading sessions. Symmetrical triangles typically resolve in the direction of the prevailing trend, though the current mixed signals between short-term consolidation and medium-term directional uncertainty make the breakout direction less predictable.
The overall market structure shows price oscillating around the critical 156.50 level, which has alternated between support and resistance roles. This price behavior, combined with the triangle formation, creates a technical environment where traders should prepare for increasing volatility as the pattern reaches its conclusion.
Fibonacci Retracement Analysis
Applying Fibonacci retracement to the EUR/JPY’s recent uptrend from February lows to early March highs reveals that the current price action is fluctuating around the 38.2%-50% retracement zone. These Fibonacci levels often represent significant decision points in the market, with the 38.2% level typically providing support during corrections within ongoing uptrends.
The convergence of these Fibonacci levels with the horizontal support and resistance zones identified earlier creates multiple confluence points that strengthen the technical significance of the 156.00-156.80 range. Resolution beyond these boundaries would provide important clues about the sustainability of the broader uptrend structure.
🔍 MARKET OUTLOOK & TRADING SCENARIOS
Bullish Scenario
The bullish case for EUR/JPY hinges on a successful break and close above the 156.80 resistance level. Such a breakthrough would likely trigger an immediate test of the 157.50 region, with potential for extension toward the recent high at 158.25 should momentum accelerate. This scenario would be reinforced by improving risk sentiment in global markets and any hawkish signals from the European Central Bank regarding monetary policy.
For this bullish resolution to gain credibility, traders should look for increasing volume during the breakout, followed by successful retests of the broken resistance as new support. The RSI’s pattern of higher lows provides a foundation for this scenario, though price confirmation remains essential for actionable trade setups.
Neutral Scenario
Given the converging moving averages and the symmetrical triangle formation, EUR/JPY may continue to consolidate between 156.00 and 157.00 in the near term. This range-bound activity could persist until a fundamental catalyst emerges to drive directional conviction. In this scenario, the pair would likely experience reduced volatility with alternating bullish and bearish sessions as neither buyers nor sellers gain decisive control.
Traders adopting this neutral perspective should focus on range-trading strategies, buying near support and selling near resistance while maintaining vigilance for eventual breakout signals. This approach requires disciplined execution with clearly defined entry and exit parameters aligned with the identified technical boundaries.
Bearish Scenario
The bearish case anticipates a decisive breakdown below the 200-day moving average and the 156.00 support level. Such a breach would likely accelerate selling pressure, potentially triggering a move toward 155.50 initially, with further downside risk toward the January lows near 155.00. This scenario could materialize if global risk aversion increases or if the Bank of Japan signals a more hawkish stance regarding future monetary policy normalization.
The relative weakness shown at recent attempts to overcome the 156.80 resistance provides some evidence supporting this bearish potential. However, traders should note that the higher lows in price structure and RSI somewhat contradict this scenario, necessitating clear confirmation before establishing substantial short positions.
💼 TRADING CONSIDERATIONS
For traders positioning around the current EUR/JPY technical structure, several strategic approaches warrant consideration:
- Breakout Strategy: Place buy orders above 156.80 with initial targets at 157.50 and protective stops below 156.20. This approach capitalizes on potential upside momentum while clearly defining risk parameters.
- Breakdown Strategy: Consider short positions on a decisive break below 156.00, targeting 155.50 initially with stops above 156.40. This strategy aligns with the bearish scenario while respecting the importance of confirmation before commitment.
- Range Trading: For more conservative traders, exploiting the current range between 156.00 and 156.80 could provide multiple opportunities, buying near support and selling near resistance until the range eventually breaks.
Volume analysis suggests increasing participation during recent price swings, indicating that when the breakout eventually occurs, it could be accompanied by significant momentum. Traders should therefore be prepared to adjust position sizes accordingly to manage risk effectively while maintaining exposure to the anticipated directional move.
Position sizing warrants particular attention in the current environment, with smaller allocations recommended until directional clarity improves. The proximity of key technical levels provides natural placement points for stop-loss orders, allowing for relatively tight risk control regardless of directional bias.
🏁 CONCLUSION
The EUR/JPY is at a critical technical juncture, with price compressed between significant moving averages and within a symmetrical triangle pattern. The balance between bulls and bears appears delicate, with both sides waiting for a catalytic event to drive the next substantial move. Traders should remain vigilant for breakouts or breakdowns from the current consolidation zone, as these are likely to precede extended directional moves.
With properly defined risk parameters, both trend-following and counter-trend strategies can be effectively deployed in the current market environment. The resolution of the current consolidation pattern will likely determine the next significant move in EUR/JPY, with the 156.50 pivot level representing a crucial battleground between bulls and bears. As price action unfolds in the coming sessions, adaptability to changing market conditions will prove essential for navigating this currency pair successfully.
⚠️ DISCLAIMER
This analysis is for informational purposes only and should not be considered financial advice. Trading carries risk, and past performance does not guarantee future results. Conduct independent research before making investment decisions.


