
📊 MARKET OVERVIEW
The German DAX40 index has entered a critical phase as price action indicates mounting bearish pressure with a clear break below key moving averages. After rejecting the 50-period moving average (red line) around 22650, the index has experienced a sharp decline toward the significant horizontal support zone at 22450. This price behavior occurs amid broader market concerns about German economic growth prospects and shifting expectations regarding European Central Bank monetary policy. The current technical structure of the DAX40 suggests that bears have gained momentum, with volume patterns confirming increased selling interest particularly during the late February trading sessions.
The deteriorating price action comes as the DAX40 has failed to maintain its previous bullish structure that had carried the index to record highs above 22800 earlier in the month. Multiple rejections at the 50-period moving average combined with bearish candlestick formations indicate sentiment has turned increasingly negative, a crucial development for traders positioning themselves in the German equity market.
📈 TECHNICAL ANALYSIS
What Are the Key Support and Resistance Levels for DAX40?
The DAX40 has established several critical technical levels that warrant close attention. The immediate support zone at 22450 represents a significant horizontal level that has previously acted as both support and resistance throughout February. This level is currently being tested and its defense is crucial for preventing a deeper correction. Should this support fail, the next significant zone appears around 22300, followed by a more substantial support region at 22150.
On the resistance side, the 50-period moving average at approximately 22650 has repeatedly rejected upward price movements, establishing itself as a formidable barrier. Beyond this level, the previous swing high at 22800 represents another major resistance zone. For any sustainable bullish reversal to materialize, the DAX40 would need to reclaim these levels convincingly with strong volume confirmation.
Moving Average Analysis
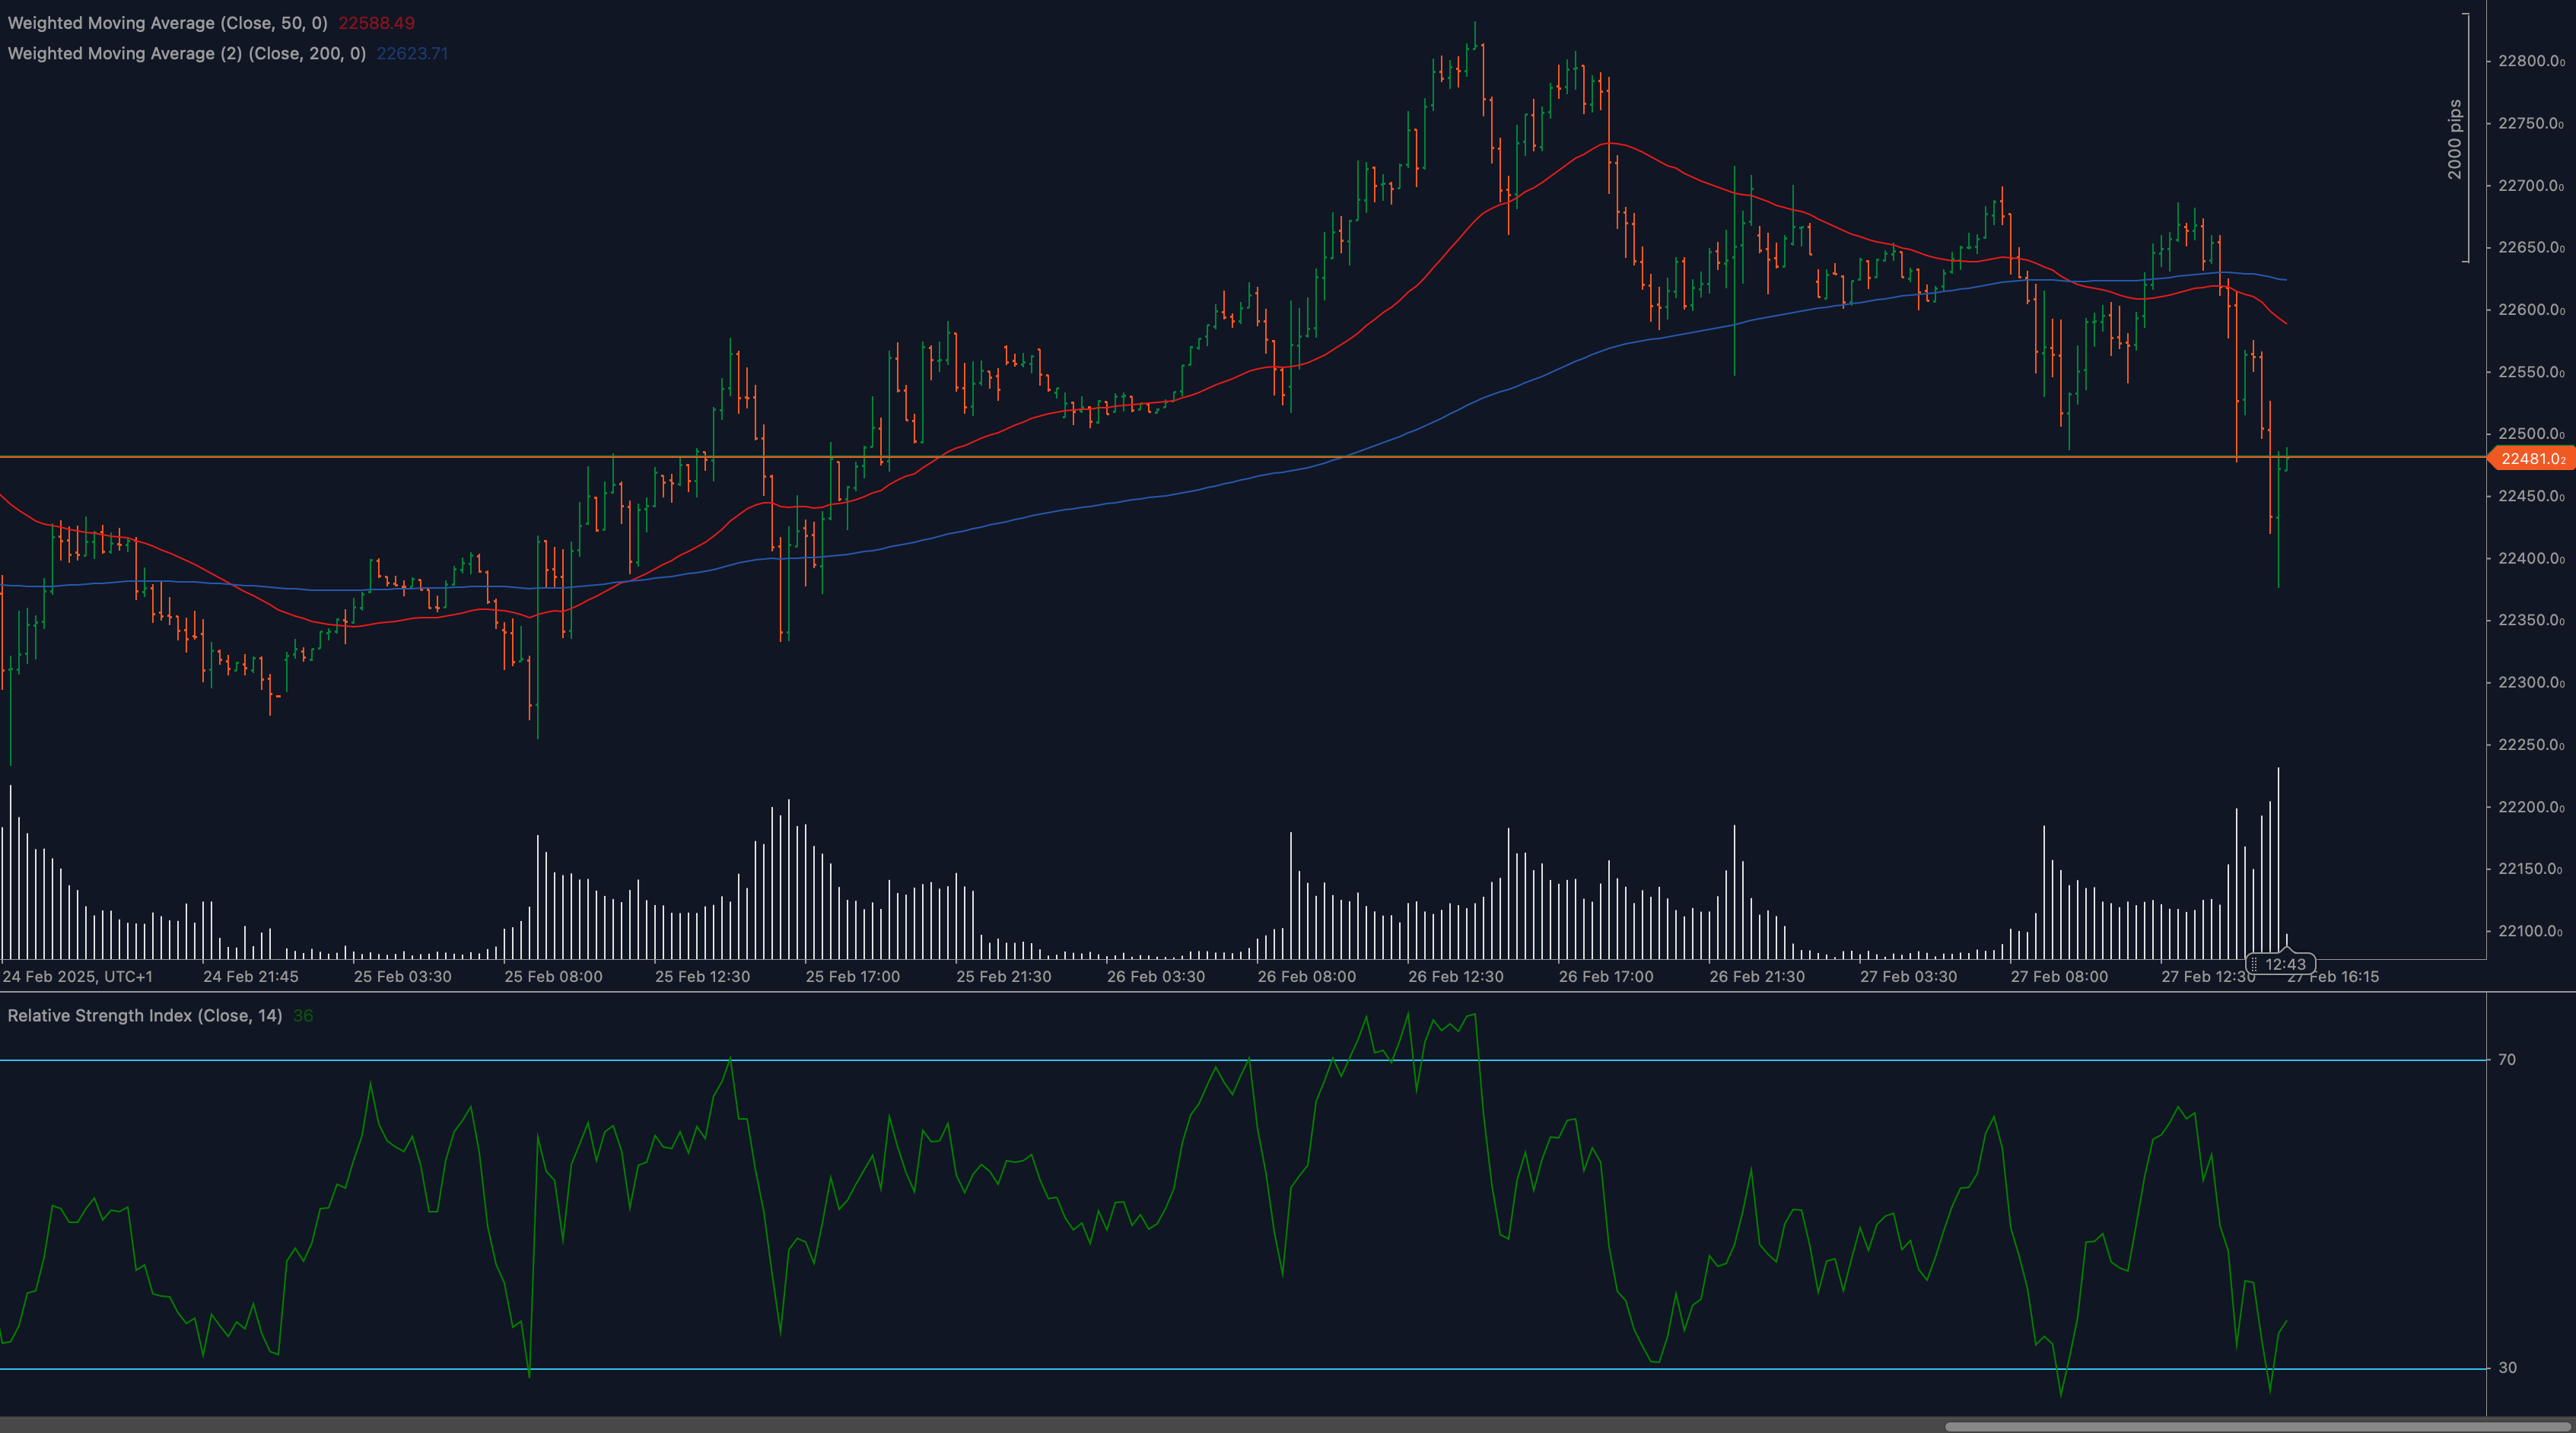
The relationship between price and key moving averages provides critical insights into the DAX40’s trend structure. Currently, price action is trading below both the 50-period moving average (red line) at approximately 22650 and the 200-period moving average (blue line) near 22550. This configuration creates a bearish bias, as these moving averages are likely to act as dynamic resistance levels during any attempted recoveries.
The 50-period moving average has started sloping downward, reinforcing the bearish narrative, while the 200-period moving average maintains a slightly upward trajectory, suggesting the longer-term uptrend remains technically intact despite current weakness. This moving average configuration creates a technical environment where short-term bearish momentum conflicts with the longer-term bullish structure, a typical characteristic of potential trend transition phases.
RSI Indicator Assessment
The Relative Strength Index (14-period) shown at the bottom of the chart has declined toward the oversold territory around the 30 level. This oversold condition often precedes temporary relief rallies as selling pressure exhausts in the near term. However, traders should note that during strong downtrends, oversold RSI readings can persist as price continues lower.
The RSI has formed several lower highs and lower lows, confirming the bearish momentum. For a legitimate reversal signal to materialize, traders should watch for positive divergence patterns where the RSI makes higher lows while price makes lower lows, though no such divergence is currently visible on the chart.
Price Action and Candlestick Analysis
Recent candlestick formations on the DAX40 chart reveal increasing selling pressure. Multiple bearish engulfing patterns and long red candles with minimal lower wicks indicate strong conviction among sellers. The repeated rejections at the 50-period moving average, characterized by bearish reversal candles, further reinforce the negative bias in the market.
The most recent trading sessions show accelerating downside momentum with expanding range candles, suggesting that bearish sentiment is intensifying rather than abating. This price action behavior, combined with increasing volume during downside moves, provides compelling evidence that the path of least resistance remains to the downside in the near term.
Chart Patterns and Market Structure
The DAX40 appears to be forming a potential head and shoulders pattern on the daily timeframe, with the right shoulder developing around the 22650 level. The neckline of this pattern coincides with the critical support at 22450, making this level even more significant. A decisive break below this support would complete the pattern, potentially triggering a measured move toward the 22000 psychological level.
The overall market structure shows a series of lower highs and lower lows since the recent peak, confirming that the short-term trend has shifted bearish. The breakdown below previous swing lows further validates this bearish structure, suggesting additional downside risk unless a significant catalyst emerges to alter market sentiment.
Fibonacci Retracement Analysis
Applying Fibonacci retracement to the DAX40’s recent uptrend from early February lows to mid-February highs reveals that the current price action is testing the 61.8% retracement level near 22450. This Fibonacci level often acts as the last line of defense before a deeper correction toward the 78.6% retracement or a complete trend reversal.
A sustained break below this 61.8% retracement would signal that the previous uptrend is significantly weakening, while a bounce from this level could indicate that bulls are attempting to protect the broader uptrend structure. The confluence of this Fibonacci level with the horizontal support at 22450 creates a magnetically important zone for trader attention.
🔍 MARKET OUTLOOK & TRADING SCENARIOS
Bullish Scenario
The bullish case for the DAX40 hinges on a successful defense of the critical 22450 support level, accompanied by oversold technical indicators suggesting a potential countertrend bounce. For this scenario to gain credibility, bulls would need to push the index back above the 200-period moving average at 22550, followed by reclaiming the 50-period moving average around 22650. Volume expansion during upside movements would provide additional confirmation that buying pressure is returning to the market.
If these conditions materialize, traders could target a move toward the recent swing high at 22800, with further potential extension toward the 23000 psychological level should broad market sentiment improve. However, this bullish scenario currently appears to have lower probability given the deteriorating technical picture, requiring substantial buyer conviction to overcome existing bearish momentum.
Neutral Scenario
A neutral outlook would involve DAX40 price action consolidating between the 22450 support and 22650 resistance, essentially trading in a range while market participants await additional catalysts to determine the next directional move. In this scenario, the index would likely experience reduced volatility with alternating bullish and bearish sessions as neither buyers nor sellers gain decisive control.
This range-bound behavior could potentially form a base for an eventual bullish reversal if accumulation patterns emerge, or alternatively, it could represent a pause before continued downside if distribution characteristics prevail. Traders adopting this neutral scenario should focus on range-trading strategies until a clearer directional bias emerges.
Bearish Scenario
The bearish case, which aligns most closely with current price action, anticipates a breakdown below the critical 22450 support level. Such a breach would likely accelerate selling pressure, potentially triggering stop-loss orders placed below this key level. In this scenario, traders would target the 22300 support zone initially, with further downside risk toward 22150 and potentially the psychological 22000 level.
This bearish outlook is supported by the current positioning below key moving averages, declining RSI readings, and the series of lower highs and lows in the price structure. A continuation of increasing volume during downside movements would further validate this scenario, suggesting that institutional participants are reducing exposure to German equities.
💼 TRADING CONSIDERATIONS
For traders positioning around the current DAX40 technical structure, risk management should take precedence given the conflicting signals between short-term bearish momentum and longer-term bullish structure. Conservative traders might consider waiting for clear confirmation of either a breakdown below 22450 or a reclaiming of the 22650 level before establishing positions, thereby avoiding the uncertainty of the current consolidation zone.
Short-term traders could consider implementing breakout strategies, preparing for a potential move below 22450 with appropriate stop-loss orders above recent swing highs. Alternatively, counter-trend traders might look for signs of reversal at the current support level, particularly if positive RSI divergence develops or if bullish candlestick patterns form near the support zone.
Position sizing warrants particular attention in the current volatile environment, with smaller allocations recommended until directional clarity improves. The proximity of key technical levels provides natural placement points for stop-loss orders, allowing for relatively tight risk control regardless of directional bias.
Traders should remain cognizant of upcoming economic data releases affecting the German economy, as these catalysts could trigger significant movements in the DAX40, potentially disrupting purely technical setups. Additionally, correlation with other European indices and broader global equity markets should be monitored as external influences could override local technical factors.
🏁 CONCLUSION
The DAX40 index has reached a critical technical juncture as it tests significant support at 22450 while trading below key moving averages. The weight of technical evidence suggests increasing bearish pressure in the near term, with multiple indicators aligning to support this bearish narrative. However, the oversold conditions reflected in the RSI and the test of major support at 22450 create potential for a technical bounce.
Traders should approach the current market structure with heightened caution, implementing strict risk management protocols regardless of directional bias. The resolution of the current support test will likely determine the next significant move in the DAX40, with the 22450 level representing a crucial battleground between bulls and bears. As price action unfolds in the coming sessions, adaptability to changing market conditions will prove essential for navigating the German equity market successfully.
⚠️ DISCLAIMER:
This analysis is for informational purposes only and should not be considered financial advice. Trading carries risk, and past performance does not guarantee future results. Conduct independent research before making investment decisions.


