
EURUSD Technical Analysis – February 26, 2025
Market Overview
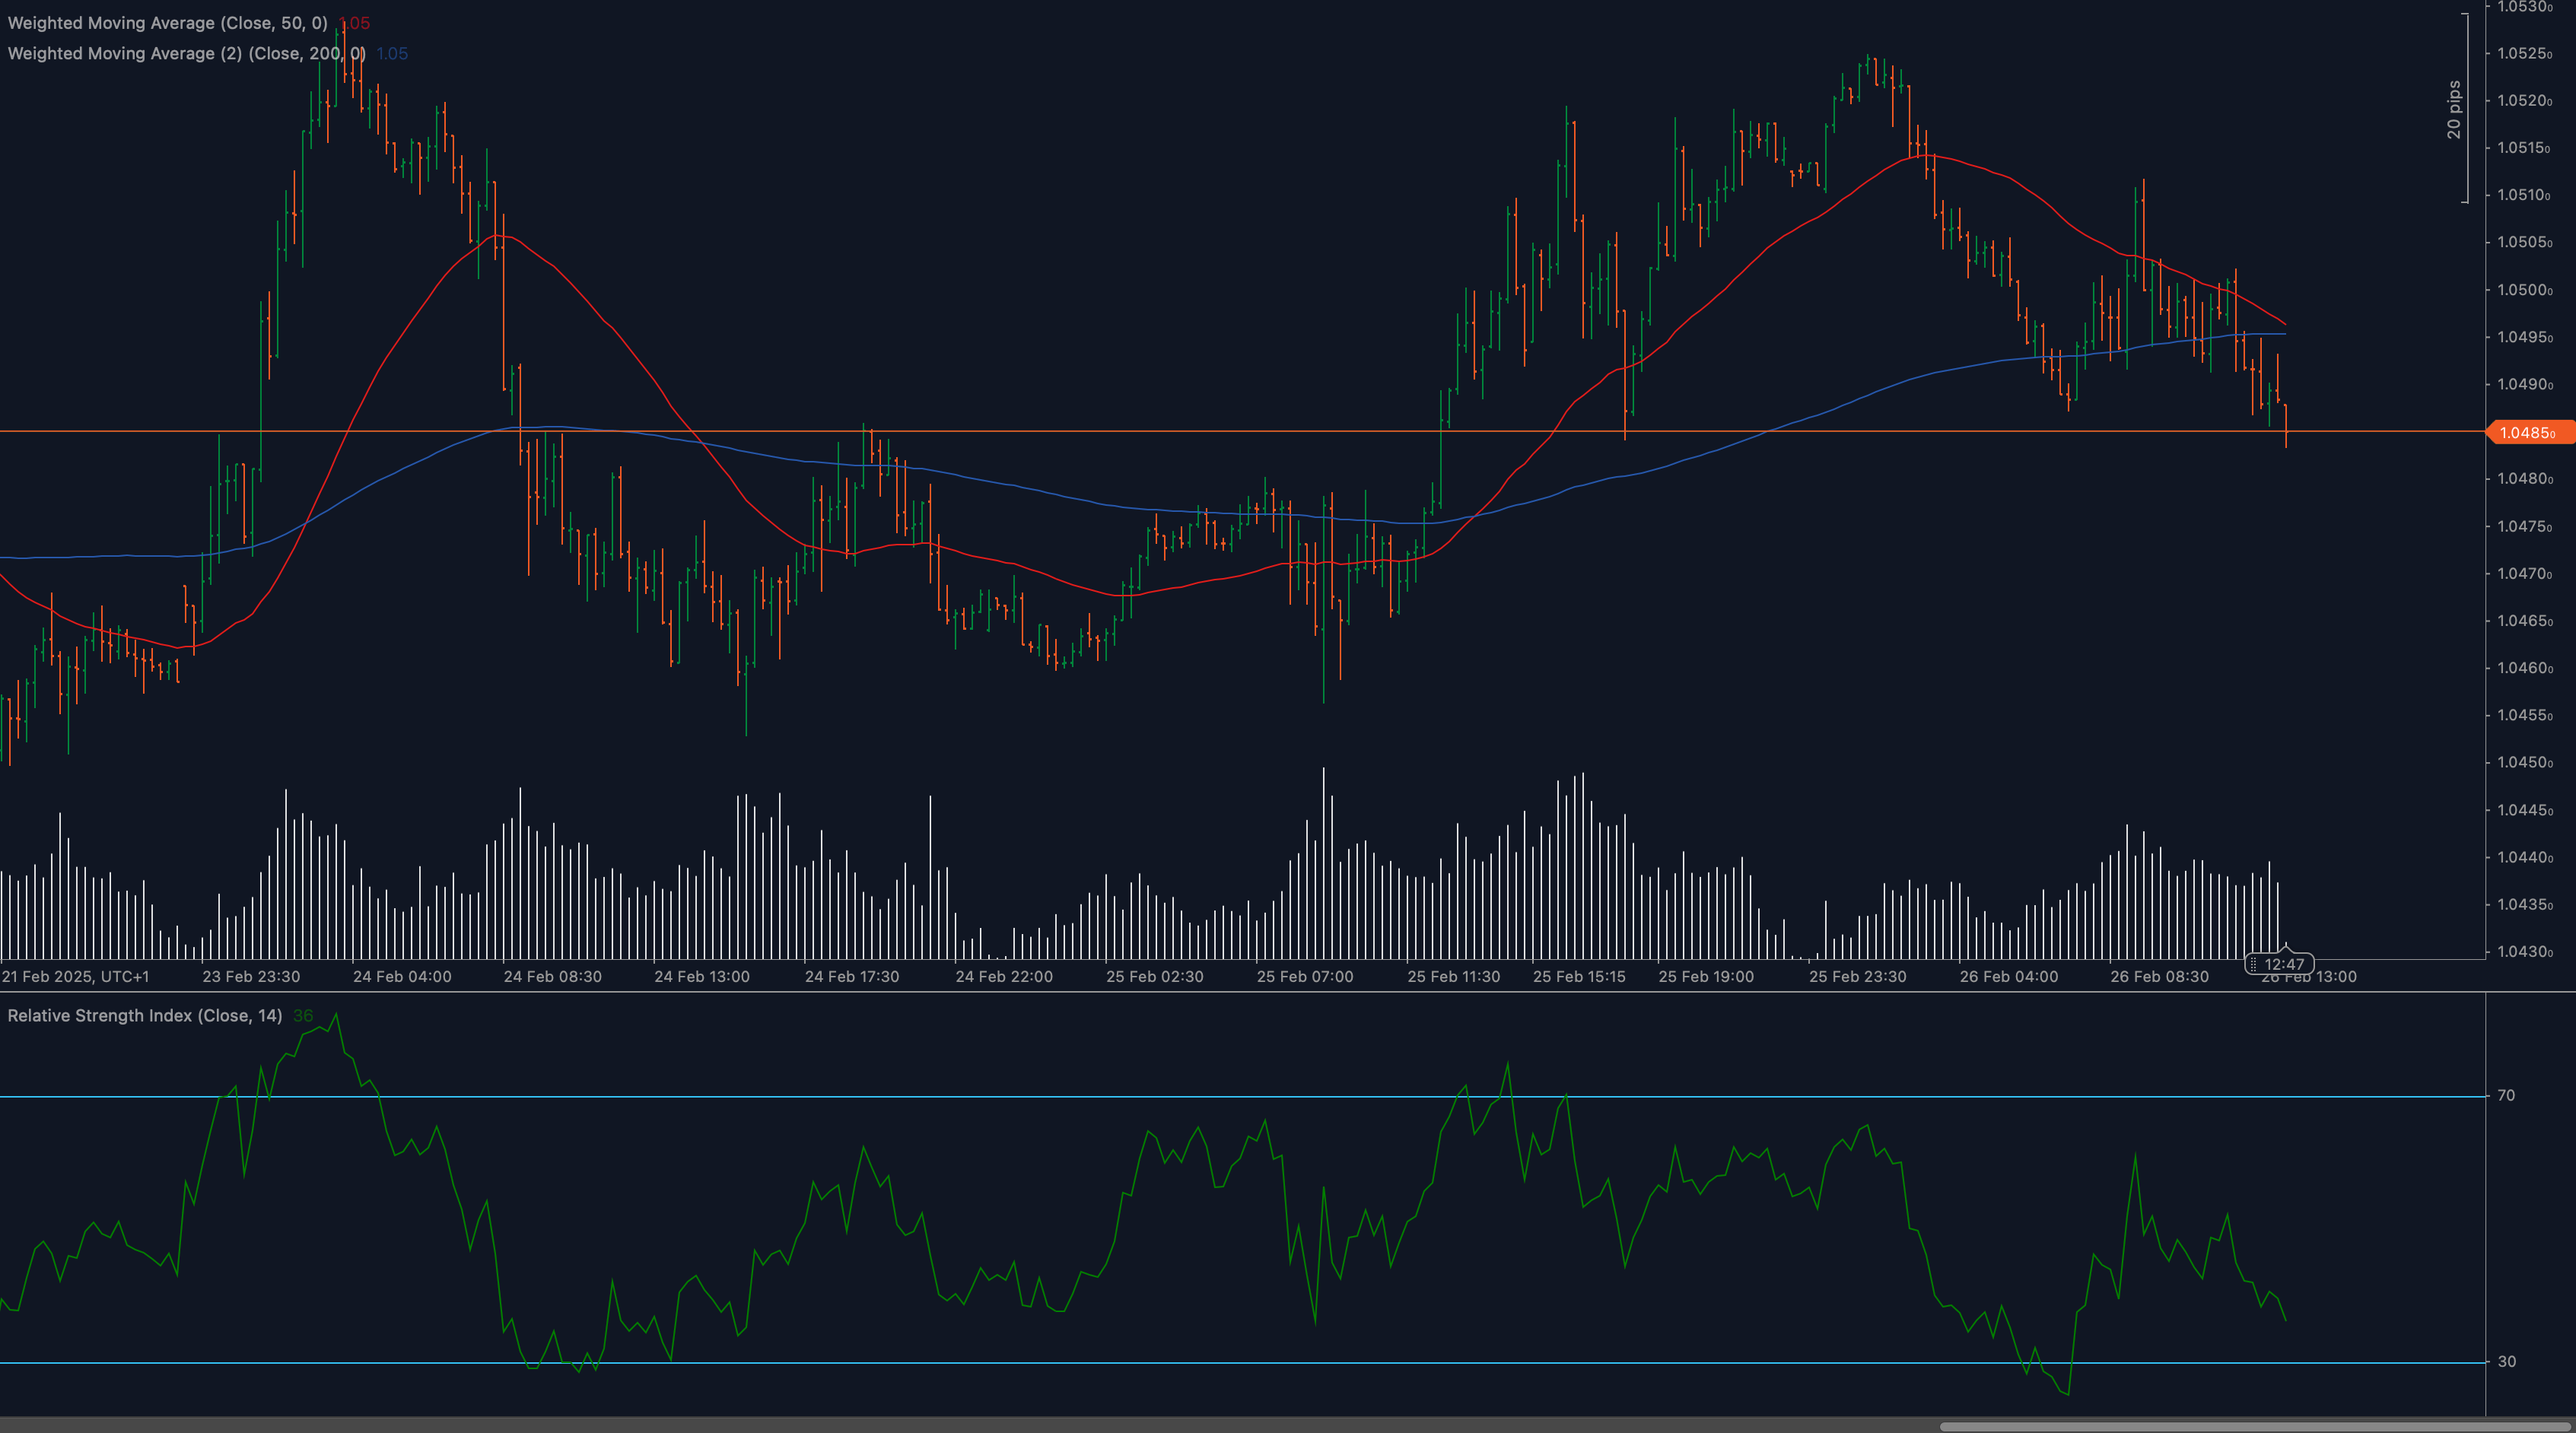
EURUSD has experienced a significant technical breakdown, with the pair decisively breaking below the critical support level at 1.0485. This move comes after a period of consolidation and represents an important technical development that could signal further downside ahead. The currency pair is now trading below both the 50-day and 200-day Weighted Moving Averages (WMAs), a bearish alignment that typically suggests sustained downward pressure. Recent price action has been characterized by declining peaks and troughs, with sellers showing increased conviction as evidenced by longer bearish candles with strong closes. The breakdown has occurred on healthy volume, suggesting genuine selling interest rather than a temporary fluctuation, and the overall technical picture has deteriorated considerably as key support levels have given way.
Technical Analysis
🔹 Support & Resistance Levels: Resistance: 1.0485 (previous support, now resistance), 1.0495 (50 WMA), 1.0510 (recent high) Support: 1.0470 (immediate support), 1.0450 (psychological level), 1.0435 (previous swing low) Historical significance: The 1.0485 area has acted as a pivotal level throughout February, serving as both support and resistance on multiple occasions, making its breach particularly significant.
🔹 Moving Averages: The 50 WMA currently sits at 1.0495, now acting as resistance after price broke below, while the 200 WMA is located at 1.0482, also breached to the downside. The crossover of price below both key moving averages confirms the deteriorating technical picture. Both moving averages are now aligned in a bearish configuration, with the 50 WMA potentially beginning to slope downward.
🔹 Relative Strength Index (RSI): Currently reading around 35-40, approaching but not yet in oversold territory, the RSI shows a formation of lower highs and lower lows, confirming building bearish momentum. The RSI has broken below its midpoint (50), typically a bearish signal, and no positive divergence is present, suggesting momentum aligns with price action.
🔹 Price Action Analysis: Recent candles show decisive bearish momentum with strong closes below key support levels. The latest bearish candles have closed below both the 50 WMA and 200 WMA, confirming the breakdown. Price action has formed a series of lower highs and lower lows, a classic sign of a developing downtrend, while volume has increased during downward movements, confirming selling pressure. Multiple attempts to recover above 1.0500 have failed, demonstrating persistent selling interest at higher levels, and several recent sessions closed near their lows, indicating selling pressure into the close.
🔹 Chart Patterns: A potential descending triangle pattern completed with the breakdown below 1.0485. The recent price action resembles a measured move down following the completion of a topping pattern, and the breakdown from the recent range trading suggests the resolution of accumulated selling pressure.
🔹 Fibonacci Analysis: If measured from the recent high at 1.0525 to the current levels, the next Fibonacci extension targets could be around 1.0450 (127.2%) and 1.0425 (161.8%). The recent decline has broken below the 61.8% retracement of the previous rally from 1.0450 to 1.0525, and a full 100% retracement would target the 1.0450 area, aligning with the psychological support level.
Market Outlook & Trading Scenarios
✅ Bearish Case:
The break below 1.0485 support could accelerate selling toward 1.0450 initially and potentially 1.0435 after that. Continued weakness below these levels could signal a more substantial decline, possibly targeting the 1.0400 psychological level. This scenario is supported by the bearish alignment of moving averages, deteriorating RSI readings, and increased volume on downside moves. Key confirmation signals would include continued closes below the 200 WMA, RSI readings moving lower without positive divergence, and rejection on any attempts to reclaim the 1.0485 level.
✅ Neutral Case:
A period of consolidation between 1.0470 and 1.0485 could emerge as the market digests recent moves. This scenario would involve range-bound trading with moderate volume and without significant directional conviction. The RSI might stabilize in the current range without making new lows, suggesting a temporary equilibrium between buyers and sellers. This neutral scenario would likely be a pause before the next directional move rather than a reversal of the current bearish bias.
❌ Bullish Case:
A recovery back above 1.0485 would be needed to neutralize the immediate bearish outlook. Reclaiming the 200 WMA at 1.0482 and then the 50 WMA at 1.0495 would suggest the breakdown was a false move. However, this scenario appears less likely given current momentum, and would require significant buying pressure with expanding volume on upside moves. Without positive divergence on momentum indicators or substantial fundamental catalysts, a sustained bullish reversal seems challenging in the near term.
Trading Considerations
📌 Breakdown Continuation Strategy: Consider short positions with initial targets at 1.0450 and secondary targets at 1.0435. Place stops above the 1.0485 former support level to manage risk. Look for continuation patterns like bear flags or consolidations before adding to positions. The ideal entry would be on any failed attempts to reclaim the 1.0485 level.
📌 Risk Management: Appropriate position sizing is crucial given EURUSD’s typically volatile nature and recent price action. Consider trailing stops as price declines to protect profits while allowing for further downside. A reasonable risk-to-reward ratio of at least 1:2 should be maintained for any new positions, risking around 25-30 pips to target 50-60 pips of movement.
📌 Time-Based Analysis: Watch for potential volatility around upcoming economic data releases, particularly those related to inflation, growth, and central bank policy in both the Eurozone and United States. The European and US trading sessions may provide clues about institutional positioning and sustained direction.
📌 Correlation Analysis: Monitor US Treasury yields and yield differentials between US and European bonds, as EURUSD typically shows sensitivity to these spreads. Keep an eye on broader dollar strength/weakness as indicated by the Dollar Index (DXY), which often moves inversely to EURUSD.
Historical Context
EURUSD has demonstrated similar technical patterns throughout early 2025, with the 1.0485-1.0500 zone repeatedly serving as a significant pivot area. Analysis of comparable breakdowns over the past several months shows that decisive breaks below key support levels that coincide with moving averages have typically resulted in 70-100 pip declines before significant support emerged. RSI readings around current levels without positive divergence have historically indicated sustainable downside momentum. Previous patterns suggest that once EURUSD breaks significant support zones, the pair tends to follow through with continued weakness for 3-5 trading sessions before attempting meaningful recoveries.
Conclusion
EURUSD is displaying a significant technical breakdown after breaching the key 1.0485 support level and trading below both the 50 and 200 WMAs. The price action shows strengthening bearish momentum, with lower highs and lower lows forming on both price and momentum indicators. The bearish case is supported by the breakdown below key technical levels, deteriorating RSI readings, and healthy volume on declining sessions. If the pair maintains trading below 1.0485, further downside toward 1.0450 and potentially 1.0435 appears likely. However, traders should remain vigilant for any signs of stabilization or oversold conditions that could trigger a technical bounce. Risk management remains paramount, with appropriate stop placement and position sizing essential given the pair’s historical volatility. The coming sessions will be crucial in determining whether the current breakdown develops into a sustained downtrend or faces support at lower levels.
⚠️ Disclaimer: This analysis is for informational purposes only and should not be considered financial advice. Trading carries risk, and past performance does not guarantee future results. Conduct independent research before making investment decisions.


