
The French CAC 40 Index (CAC40) closed at 8,178.54 on Friday, February 14, 2025, extending a streak of gains and marking a 2.9% weekly increase. The index is showing strong positive momentum, having broken out of a previous falling trend in the medium term. While currently consolidating, the index is testing resistance, and a breakout could signal further upside. However, some indicators suggest overbought conditions, warranting a degree of caution.
Detailed Technical Analysis
- Breakout from Falling Trend: According to Investtech’s medium-term analysis (February 14, 2025), the CAC 40 has broken above the ceiling of a falling trend channel. This is a significant bullish development, indicating a potential shift in the medium-term trend.
- Consolidation and Resistance Test: While the longer-term trend appears bullish, the index is currently in a short-term consolidation phase. It’s testing resistance around the 8,200-8,220 level (multiple sources confirm this resistance zone).
- 📉 Moving Averages (MAs):
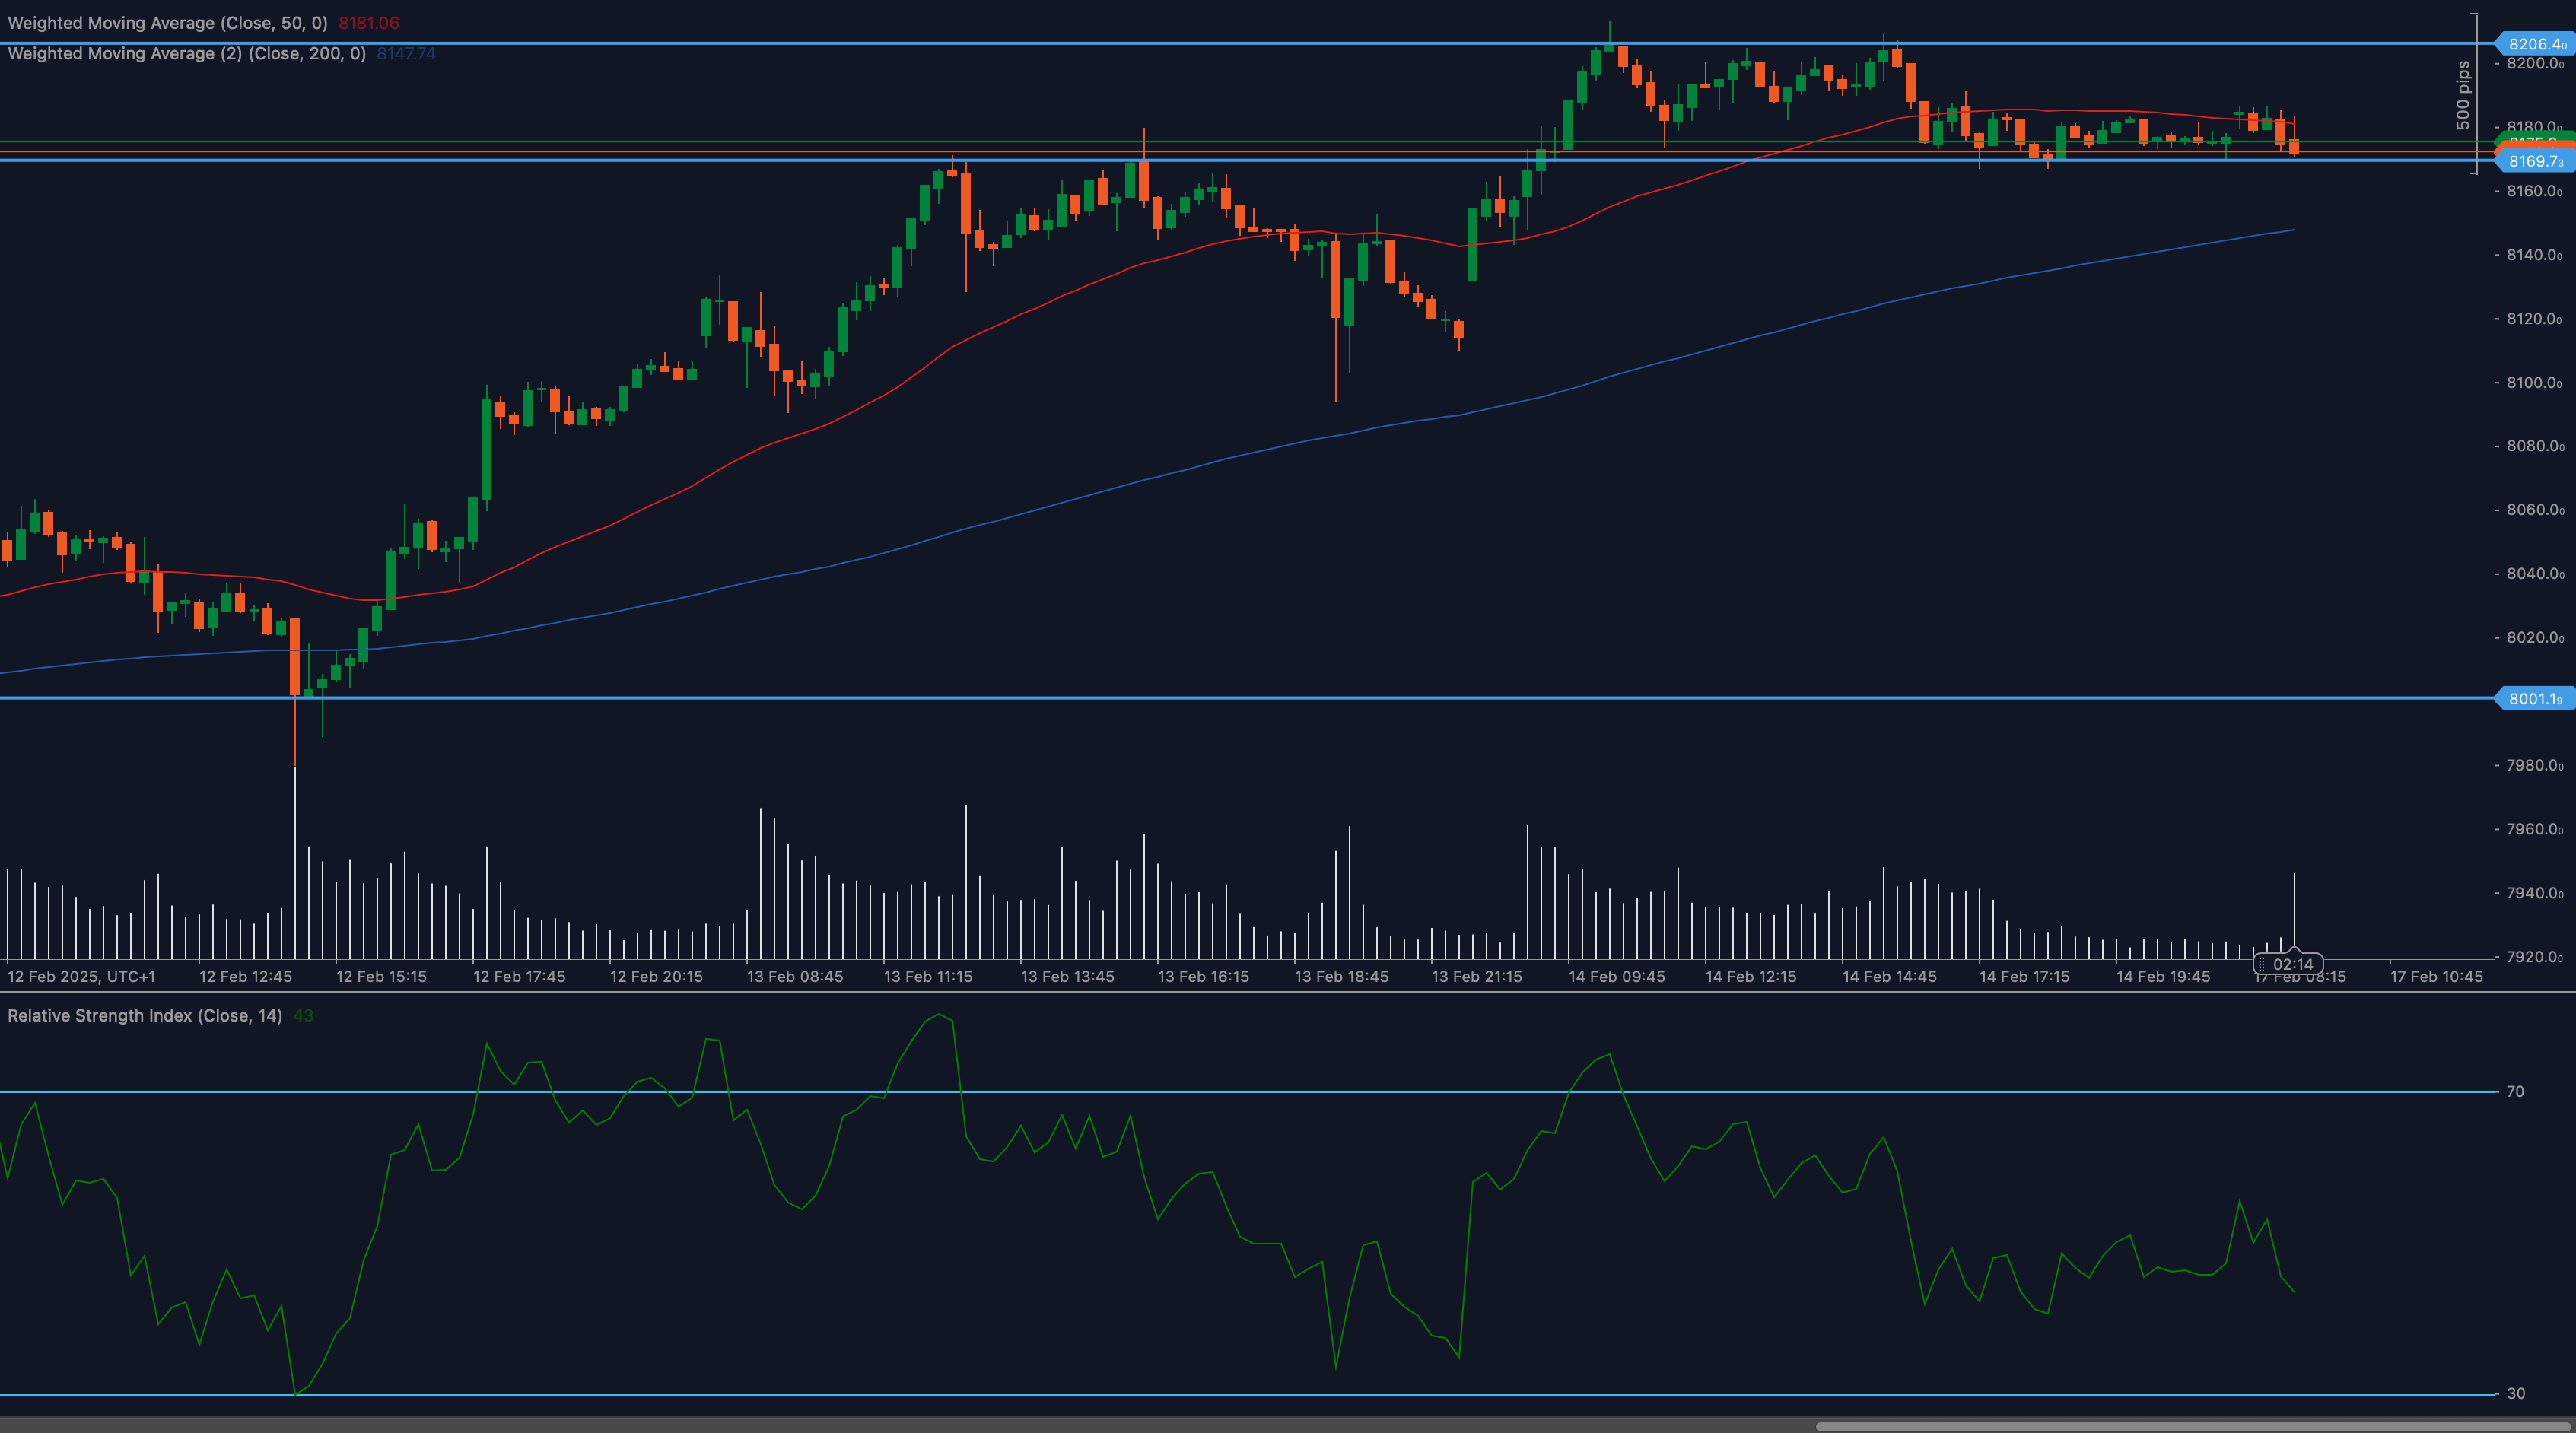
- The 50 Weighted Moving Average (WMA) at 8,181 is slightly above the current price, while the 200 WMA at 8,174 provides additional support. This suggests a neutral trend unless a decisive breakout occurs.
- 📊 Relative Strength Index (RSI): Multiple sources from February 14, 2025, indicate the RSI is now above 70 (Investtech) or signaling overbought conditions (Minipip, DailyForex). This is a major change. An RSI above 70 suggests the index is overbought, increasing the probability of a pullback.
🔎 Key Support and Resistance Levels:
- Support:
- 8,169: The immediate support level.
- 8,011: Major lower support.
- 7,837-7,850: Trading Economics expects the CAC40 to trade at 7837.28 by the end of the quarter. Other sources also highlight the 7850 area. This zone becomes a significant support level to watch on any pullback.
- 7,600 and 7,500: Key support levels.
- Resistance:
- 8,206-8,220: The immediate resistance zone.
- 8,250: The next upside target.
- 8,715: Long term resistance
- 7,700 and 7,800: Although lower than the current level, these are resistance levels that were relevant in January 2025.
Fundamental Factors Influencing the CAC 40
- Eurozone Stock Market Sentiment: Positive sentiment across European markets is supporting the CAC 40.
- Corporate Earnings: Strong Q4 earnings, particularly from luxury goods companies like Hermès, LVMH, and Kering, have boosted the index. Future earnings releases will be critical.
- ECB Policy Expectations: The market is constantly evaluating potential ECB monetary policy actions, which will influence the index.
- French Economic Data: France is emerging from a recession, which is a positive factor. Key economic data releases will continue to be important.
- Global Equity Trends: The overall global risk appetite, reflected in major indices like the S&P 500, will influence the CAC 40.
Outlook and Trading Considerations
- Bullish Scenario: A decisive break above 8,220, despite the overbought RSI, would signal strong momentum and potentially open the way for a move towards 8,250 and potentially higher.
- Bearish Scenario: Given the overbought RSI, a pullback is a significant possibility. Failure to hold 8,169 could lead to a test of lower support levels, with 7,837-7,850 being a key area to watch.
Trading Recommendation:
The CAC 40 is at a critical juncture. The overbought RSI suggests caution is warranted, despite the overall bullish trend.
- Aggressive Traders: Might consider small long positions on a confirmed breakout above 8,220, with tight stop-loss orders below.
- Conservative Traders: Should wait for a pullback and a more favorable RSI reading before considering long positions.
- Short Sellers: Might consider small short positions if the index shows clear signs of weakness below 8,169, with tight stop-loss orders above.
Volume is crucial: Any breakout or breakdown should be accompanied by strong trading volume to confirm the move’s validity.
Disclaimer: This analysis is provided for informational purposes only and should not be considered financial advice. Trading in financial markets carries inherent risks, and past performance is not a guarantee of future results. Always conduct your own independent research and consult with a qualified financial advisor before making any investment decisions.


